

Imagine a quarterly planning meeting where every department already knows next month’s demand curve, the inventory that will be required in each region, and the cash flow needed to support it all. That vision is more than a thought experiment.
Modern AI forecasting engines sift through years of historical data, live market signals, and real-time operational metrics to produce future demand predictions that get continuously sharper as new information arrives. The result is a dynamic map of probable futures that business leaders can act on with confidence.
What is AI forecasting?
At its core AI forecasting, uses machine learning algorithms instead of fixed statistical equations. Traditional forecasting often assumes that relationships among variables stay constant. AI models learn those relationships directly from data, then adapt as soon as the underlying patterns shift.
Techniques range from gradient-boosted decision trees that capture non-linear interactions to recurrent neural networks that specialize in time-series sequences. For executives this means a demand forecasting model that adjusts to seasonality swings, promotion spikes, or sudden supply constraints without waiting for a human analyst to rewrite formulas.
Key concepts in plain language
- Data features: The model consumes both internal signals—sales orders, production rates, website traffic—and external ones such as macroeconomic indices or weather feeds. Think of features as internal and external data needed for accurate forecasts, ingredients that determine the flavor of the forecast.
- Training and retraining: The initial model is trained on labeled history. A retraining schedule then keeps it fresh and capable of accurate predictions under new circumstances. Continuous learning prevents drift caused by buyer behavior changes, demand fluctuations, and other external factors.
- Confidence intervals: AI systems output a most-likely value plus a probability band around it. Executives can plan safety stock or budget reserves based on quantifiable risk, not gut feel.
Where Enterprises see Impact
The business value of AI forecasting becomes clear when it’s applied to high-stakes, data-rich environments. Across industries, companies are using these forecasting tools not just to predict future outcomes, but to shape them across various industries and functions:
- Supply chain: Global manufacturers use AI forecasts for supply chain management, to rebalance component inventories daily, and trim working capital while protecting on-time delivery.
- Finance: Banks feed transactional data into deep-learning models that predict demand for services, loan prepayment, and portfolio risk more accurately than classical credit scoring.
- Energy: Utilities forecast load at the sub-station level to fine-tune generation and reduce reliance on expensive peaker plants.
- Healthcare: Hospitals predict patient admissions and optimize bed capacity, staffing, and drug procurement days in advance.
Practical benefits
Beyond theory, AI forecasting leads to more accurate predictions across the board, helping organizations act faster and more effectively. Models ingest thousands of variables, revealing weak signals that linear regressions miss. In head-to-head trials companies often see mean absolute error drop by twenty to thirty percent.
The ability to quickly process large volumes of structured and unstructured data also results in faster response. Automated pipelines push new data to production models in minutes, so forecasts update before weekly meetings and drive truly agile operations.
Interactive dashboards expose both the number and the rationale, complete with feature importance scores, scenario overlays, and historical data. They allow finance, operations, and sales to work from the same source of truth.
It is when all these benefits are combined that we see the impact of artificial intelligence on the bottom line. A retailer uses historical sales data and external data sources to detect an emerging trend weeks before rivals. Management uses the information to make decisions quickly, marketing and sales get a head start, and the company optimizes resource allocation and supplier capacity to dominate shelf space long before the competition reacts.
Looking beyond the hype, AI forecasting isn’t infallible. Implementation discipline still matters, and technology won’t solve every problem on its own. Yet when executed well, AI algorithms turn data into a strategic asset, converting uncertainty into a spectrum of measurable options. Leadership teams that harness these predictive insights gain the freedom to focus on strategy rather than execution, and firefighting.
Tools and Technologies Behind Modern AI Forecasting
AI forecasting stands on a layered technology stack that blends data engineering, statistical science, and machine-learning research. Understanding the pieces in that stack helps leadership choose the right tool for each business problem and budget.
From raw data to model features
Every credible forecast starts with clean, well-labeled data. A central lake stores transactional history, sensor feeds, and third-party signals such as commodity prices or weather indices. A feature store then transforms these raw tables into model-ready columns: rolling averages, calendar flags, price elasticity measures, and sentiment scores. By standardizing feature creation the organization reduces engineer time and ensures that finance, operations, and sales run on identical definitions.
Algorithms and techniques that do the heavy lifting
Once the data is cleaned and structured, the real work begins. Behind every forecasting model is a core algorithmic approach that defines how it processes data and detects patterns. Each technique has tradeoffs in terms of complexity, interpretability, scalability, and how well it handles uncertainty or noisy input. Below are the most common families in the forecasting space and how they typically get used.
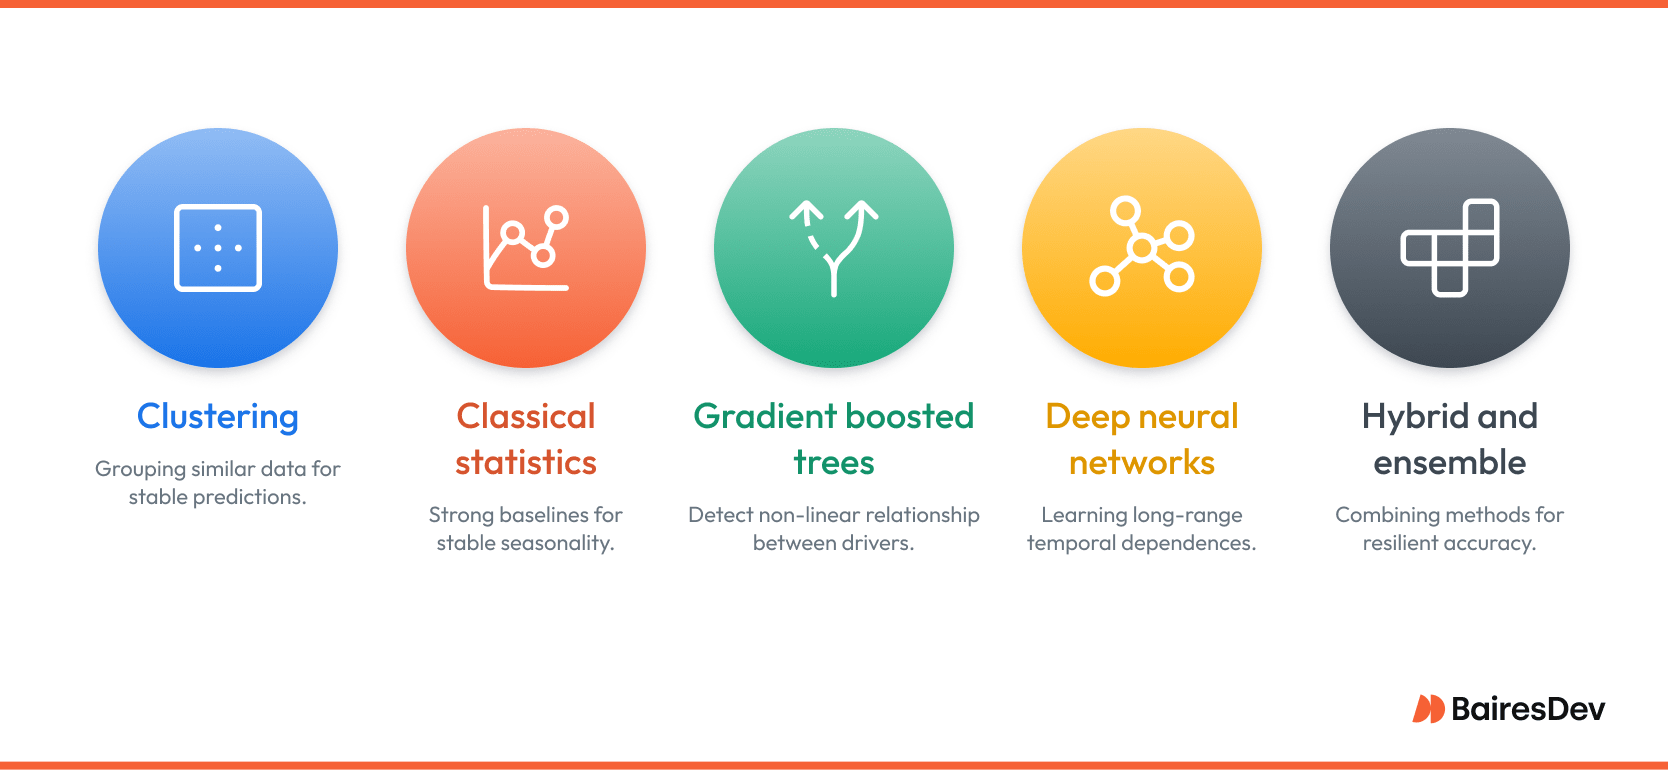
Clustering: Density-based or centroid-based clustering groups products, stores, or customers that behave similarly. The result is fewer segments to model and more stable predictions when a new SKU appears with little history. K-means remains popular for its speed, while Gaussian Mixture clustering captures overlapping segments where item behavior is not mutually exclusive.
Classical statistics: Techniques like exponential smoothing and the ARIMA family still provide strong baselines, especially for single-variable series with long history and stable seasonality. They are computationally light, easy to interpret, and often serve as benchmark models for more advanced methods.
Gradient boosted decision trees: XGBoost, LightGBM, and CatBoost detect non-linear relationships between dozens of drivers, from promotion depth to social-media buzz. Because trees handle missing values and outliers gracefully they thrive in retail, telecom, and CPG environments where data cleanliness is never perfect.
Deep neural networks: Recurrent architectures such as LSTM and GRU excel at learning long-range temporal dependencies that stump classical models. Convolutional and Transformer networks extend that power by sharing parameters across thousands of related series, capturing subtle cross-category influences in manufacturing or energy. These networks do require more data and GPU horsepower, but when tuned correctly they can cut error rates in half on highly volatile lines.
Hybrid and ensemble approaches: No single method wins every day. Ensembles that combine statistical, tree-based, and neural outputs often deliver the most resilient accuracy. Weighted averages or stacked meta-learners reduce volatility because each model type fails under different conditions.
Interpretability and trust
Executives need more than a point estimate. Modern frameworks layer Shapley values, partial-dependence plots, and counterfactual analysis on top of complex models.
These diagnostics reveal which drivers move the forecast and by how much, giving finance leaders the confidence to base multimillion-dollar budget calls on a black-box network.
Model operations at enterprise scale
Once models exit the lab they require monitoring similar to a high-availability application. Data-drift detectors track feature distributions, prediction-drift monitors watch error metrics in production, and automated retraining pipelines refresh weights when accuracy dips.
MLOps platforms such as MLflow, Kubeflow, and Tecton orchestrate this lifecycle, integrating with CI/CD so that model changes follow the same audit trail as software releases.
The tool landscape: cloud, platform, and open source
A few vendors have wrapped the technology layers into turnkey services that shorten time to value.
- Cloud managed services. Amazon Forecast, Google Vertex AI Forecast, and Azure Auto Time Series offer automated feature engineering, hyper-parameter search, and scalable inference with minimal DevOps overhead.
- Enterprise planning suites. SAP Integrated Business Planning, o9, and Anaplan embed AI forecasting inside supply-chain and financial-planning workflows so planners consume predictions directly in the tools they already use.
- Open-source libraries. Facebook Prophet, PyTorch Forecasting, GluonTS, Darts, and scikit-learn let internal data-science teams craft bespoke pipelines when regulatory or competitive constraints demand full control of the code base.
Choosing the right mix
Selection hinges on data volume, latency requirements, and in-house skill.
A retailer with billions of daily transactions might lean on a cloud service to elastically scale GPUs during holiday peaks. A regulated bank may favor open-source models deployed on-premises for auditability. Hybrid architectures are common: a managed service for fast prototyping, then a custom neural model for the few product lines that drive most revenue.
By mapping these technologies to business priorities leadership can invest in the smallest set of tools that still covers accuracy, transparency, and operational resilience. The next section will translate those choices into a structured implementation roadmap, from setting goals to continuous monitoring.
Implementation Blueprint: Turning AI Algorithms into Business Outcomes
A successful demand forecasting rollout begins with crystal clear objectives. Leadership should frame the question in language the model can answer, for example “Predict weekly demand for each distribution center at a ninety five percent confidence level.” A goal that precise helps the team choose the correct horizon, granularity, and error metric.
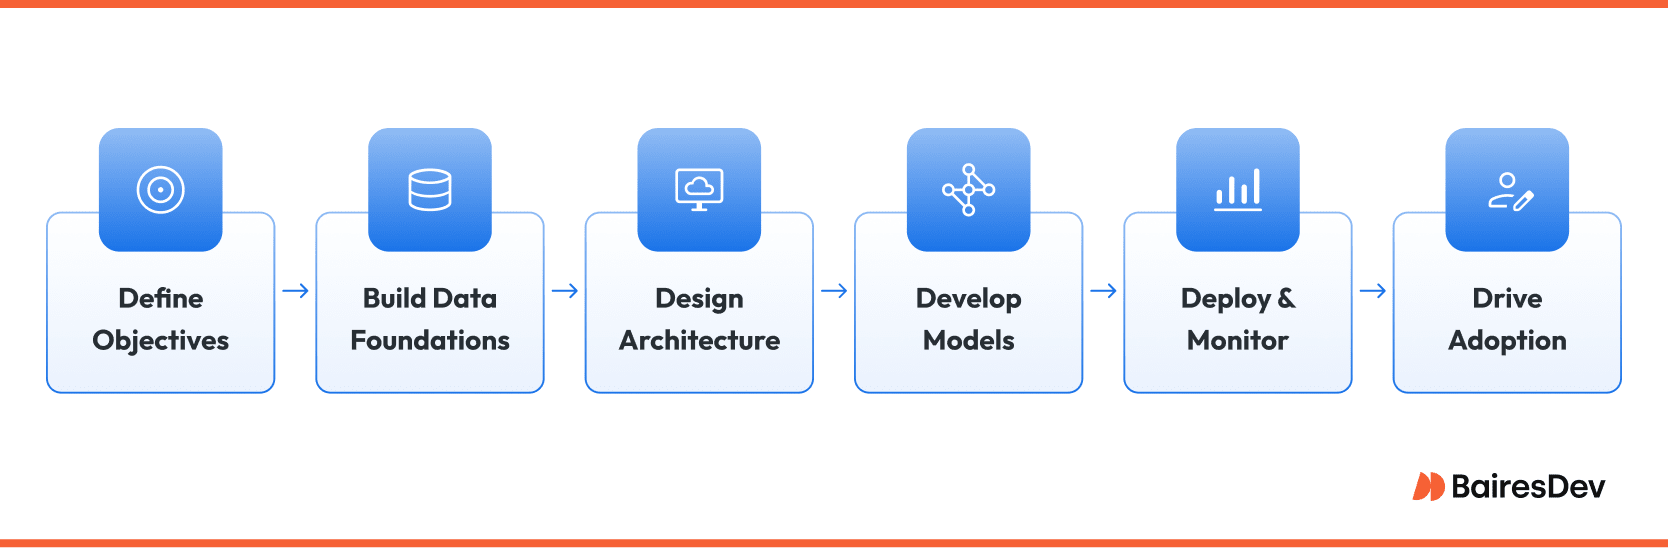
Data foundations: Most projects fail not because of poor models but because of patchy data. Start by cataloging every relevant source. Point of sale transactions, promotional calendars, supplier lead times, macroeconomic indicators, and even weather feeds often matter. Once the catalog is complete, build a feature store so definitions are shared company wide. Finance, operations, and data science will then speak the same language when they refer to unit volume or seasonality index.
Pipeline architecture: Raw files land in an immutable data lake for lineage. A streaming layer can capture high velocity signals such as sensor readings. From there an orchestration engine schedules feature computation, model training, back testing, and inference. Many firms use Airflow or Prefect for scheduling, Spark or Snowpark for transformation, and Kubernetes to host both notebooks and production inference services. Security wraps the entire stack with role based access and audit logging.
Model development and governance: Data scientists explore candidate algorithms offline, tracking every experiment with MLflow or Weights and Biases. They benchmark using a relevant metric, commonly mean absolute percentage error for retail or root mean square error for energy load. Once a champion model meets the acceptance threshold it is packaged as a container image and promoted to a staging environment. A governance board reviews model cards that summarize data provenance, fairness tests, and interpretability reports before approving production deployment.
Productionization and monitoring: After promotion, the model serves forecasts through an API or writes them to an analytical warehouse where planners consume them in Power BI or Tableau. Continuous monitoring checks three signals: input drift, prediction drift, and business impact. If drift breaches tolerance the pipeline triggers automated retraining. All artifacts are versioned so the team can roll back quickly if a new model underperforms.
Change management and adoption: Even the sharpest forecast will be ignored if planners do not trust AI forecasting tools. Early in the process, invite domain experts to critique feature selection and error thresholds. Provide dashboards that expose not just the number but also the top drivers in each prediction. Finally, measure adoption with simple metrics such as the percentage of planning decisions that rely on the AI output.
Key success factors:
- Treat data quality as a first class product with its own owner and SLA.
- Automate every repeatable step from data collection and feature engineering to deployment to avoid bottlenecks.
- Link model forecast accuracy to financial impact so the value story is evident to the board.
With these foundations in place AI forecasting moves from proof of concept to a living system that continuously sharpens its guidance as the business evolves.
Challenges and Risks
No technology transformation is friction-free. AI forecasting introduces obstacles that fall into three broad groups.
Business and cultural hurdles
Organizations accustomed to traditional methods and spreadsheet-driven planning may resist automated recommendations. Middle managers sometimes feel their judgment is being replaced by artificial intelligence.
Consistent executive sponsorship, transparent communication, and joint workshops where human experience fine tunes model outputs help diffuses this fear. Budget is another constraint. High performance infrastructure and specialized talent carry costs that must be justified with a clear return on investment roadmap.
Regulatory and ethical considerations
Industries such as healthcare, banking, and telecom operate under strict privacy laws. Training data may contain personal information that requires anonymization or consent management. Regulations like GDPR and the California Consumer Privacy Act impose penalties for misuse.
In finance, model risk guidelines from the Federal Reserve demand rigorous testing and documentation of every statistical assumption. Explainability is not optional; auditors need to see why the system recommended a capital allocation or loan prepayment rate.
Technical and operational risks
Data drift can erode accuracy silently. A competitor launches an aggressive promotion, a pandemic changes buying patterns, or a sensor calibration drifts. Without automated drift alerts the system will keep producing confident but wrong numbers.
Scaling is another challenge. A global retailer might need forecasts for hundreds of thousands of item location pairs every hour. That data processing load stresses compute budgets and network latency if the pipeline is not designed for parallel processing. Security cannot be an afterthought either. The forecasting stack often connects to core ERP and supply chain systems which makes it a prime target for attackers.
Summary of common AI forecasting pitfalls:
- Underestimating the effort required to clean and maintain data pipelines.
- Deploying complex neural networks without an explainability layer that business stakeholders understand.
- Neglecting a retraining schedule, leading to stale models that steer decisions off course.
By acknowledging these risks early and embedding mitigation steps into the project charter, leadership turns potential show stoppers into manageable workstreams. A disciplined approach keeps compliance teams satisfied, safeguards operational stability, and ensures that the promise of AI-powered foresight translates into a sustained competitive advantage.
If you enjoyed this, be sure to check out our other AI articles.
- AI in Banking: Transforming the Financial Landscape
- AI in Manufacturing: A Game Changer
- The Impact of AI on Supply Chain Management
- 4 Major Ways in Which AI is Changing Entertainment
- AI Isn’t Scary!: Here’s Why It’s Changing Our Lives for the Better
Frequently Asked Questions:
How is AI forecasting different from traditional forecasting methods?
Traditional forecasting uses fixed equations and assumptions; AI learns patterns directly from data and adapts as those patterns change. This lets it capture subtle, complex relationships without needing manual updates, making forecasts more flexible and responsive.
How accurate are AI forecasting models compared to traditional models?
Properly implemented AI models typically reduce forecast error by 20–30% compared to traditional approaches. More importantly, they adjust faster when conditions shift, keeping predictions aligned with real-world changes.
What types of business problems can AI forecasting solve?
AI forecasting helps with any problem involving repeated predictions under uncertainty: demand planning, revenue forecasting, credit risk, supply chain optimization, labor scheduling, or marketing performance. Anywhere you have data and variability, AI can sharpen decision-making.
What internal skills and roles are required for successful AI forecasting?
You need data engineers for pipelines, data scientists to build models, and MLOps teams for deployment and monitoring. Business experts interpret results, and leadership sets goals and ensures alignment. Without cross-functional support, even strong technical teams can struggle.
What kind of data do I need to get started with AI forecasting?
You need reliable, historical data tied to what you’re forecasting—like sales, operations, or financial records. External signals like weather or market trends can add value. But data quality is key; messy or incomplete data will sink any model, no matter how advanced.


