

Most AI models don’t fail because the algorithms are bad, but because teams optimize for the wrong metrics. A 2025 Ernst & Young survey of nearly a thousand executives overseeing AI initiatives found that only 19% saw meaningful revenue gains from AI, and just 18% reported major cost savings. When you’re familiar like our team is with these deployments, those numbers aren’t surprising.
If we accept that AI’s end goal isn’t perfect accuracy, then the real work in AI development becomes understanding which types of errors matter for your business, which ones don’t, and how each one affects outcomes. The right trade-offs look very different in finance than in customer support, or in an internal workflow versus a public-facing product.
Model metrics aren’t academic statistics. They describe the trade-offs a system makes in production—between reliability, cost, speed, and risk. There’s no universally “best” model, only models that fit specific business constraints. Because AI systems behave differently under real-world conditions than in controlled tests, these metrics are often the only early warning you’ll get before problems scale. Here’s what actually matters and how to interpret them for your industry context.
What AI Performance Actually Means
Accuracy is the metric everyone reaches for first because it’s simple to understand: “how often is the model right overall?” But real AI performance has more dimensions, and each one affects a different part of the business.
A customer service AI might be 95% accurate but take 8 seconds per response. That’s great for quality, but terrible for user experience. A fraud detection model might flag transactions in milliseconds but generate so many false positives that manual review costs exceed the savings. The right balance depends on what your business can’t afford to get wrong.
Even when you optimize these dimensions, real-world performance can decay. A model can score perfectly on test data and still fail in production once user behavior shifts or edge cases emerge. This phenomenon—model drift—happens when the world changes faster than the model does. Imagine a GPS that works flawlessly in ideal conditions but reroutes you into traffic the moment a road closes or construction pops up.
To understand whether your AI works where it matters, you need to look at the dimensions hiding underneath it. These metrics directly translate to things leadership cares about: revenue at risk, customer churn cost, operational waste, regulatory exposure, and cost per decision when the system runs at scale. These are your baseline.
Below, I break down each performance metric, how it maps to business outcomes, and what it looks like in real-world systems.
-
Accuracy / Task Quality
Precision — How Often It’s Right When It Acts
Precision measures how trustworthy the AI is when it raises a flag. In business terms, a “flag” is the AI telling you, “This needs attention,” whether that’s a suspicious transaction, a defective part, a risky email, or a high-priority support case.
High precision means the AI rarely bothers you or your team unnecessarily. Low precision means constant false alarms that burn time, add costs, and irritate users. Every unnecessary alert creates work that didn’t need to happen, showing up as support tickets, manual reviews, or customer frustration. At scale, these false alarms become churn, operational drag, or trust erosion.
Take fraud detection. If the AI freezes too many legitimate customer accounts, your teams drown in support calls and customers lose confidence in the product. Even a small percentage of incorrectly flagged accounts can create thousands of avoidable interactions.
Recall — How Much It Actually Catches
Recall measures the other side of the equation: of all the things your AI should catch, how many does it actually identify? Where precision protects you from false alarms, recall protects you from missed problems. Think of fraud that goes undetected, unsafe items that pass inspection, or compliance issues that never surface.
Missed cases are often far more expensive than false alarms. They show up as revenue leakage, undetected risk, safety incidents, or regulatory exposure. In insurance, for example, a fraud detection AI that misses even 0.1% of fraudulent claims can end up leaking millions over a year. The dashboard won’t show the cost of those misses, but the bottom line will.
F1 Score — Are You Balancing Both Types of Errors?
Precision and recall rarely move in the same direction. If you improve one too much you usually hurt the other. F1 score measures whether the AI is balancing the trade-offs in a way that minimizes the total cost of mistakes. Think of F1 as the metric that answers a simple business question: “Is the system catching what it needs to catch without overwhelming us with noise?”
This balance matters most in scenarios where both kinds of mistakes are costly. Picture a power grid where catching more anomalies is good, but if doing so creates a surge in unnecessary truck rolls, field teams waste time and budgets get stretched. On the other hand, if you lower false alarms too much, you risk missing a real instability event that could lead to outages or regulatory penalties. F1 helps you find the equilibrium where neither cost overwhelms the other.
AI Model Metrics: Accuracy/ Task Quality
| Metrics | What Question Does it Answer? | Business Metrics Impacted | Technical Ways of Measuring It |
| Precision | How often is the model right when it raises a flag? | False-alarm cost, customer churn from unnecessary friction, operational review workload | True Positives* ÷ (True Positives + False Positives) |
| Recall | How many important cases does the model actually catch? | Revenue at risk, fraud leakage, compliance exposure, safety-related misses | True Positives ÷ (True Positives + False Negatives) |
| F1 Score | Is the model balancing the cost of false alarms and misses effectively? | Support volume, incident rate, operational efficiency, cost of errors | Harmonic mean of Precision and Recall |
*Positives are the target cases the model is intended to identify, such as fraud attempts, safety risks, defects, or other events of interest.
-
Operational Performance
Latency and Throughput — How Fast And How Much
Latency is how long the AI takes to return an answer. Throughput is how many answers it can deliver in a given time window. Together, they determine whether the system keeps up with the pace of your business.
For leaders, these translate directly into customer experience, operational speed, and cost per decision. A model that responds too slowly can ruin a product experience and delay internal workflows. If customers wait more than a second or two, they abandon the interaction and that lost engagement shows up as lower conversion or higher support hand-offs. And for internal systems, slow decisions stretch cycle times: every delay in underwriting, routing, or triage pushes revenue recognition or risk mitigation further out.
Imagine a fintech firm building a fraud detector that takes 500ms (milliseconds) per transaction, causing payment timeouts and angry customers. To keep transactions flowing, they need sub-200ms responses. Switching to a faster, more efficient model design drops latency to 150ms. Same protection, radically faster. You keep customers happy and maintain high transaction completion rates, proving how latency is a key metric to pay attention to.
Performance Per Dollar — What Does Each Decision Cost?
Performance per dollar looks at how well the model performs relative to what it costs to operate at scale. It’s about ongoing cost per prediction, which determines whether the model is commercially viable beyond a pilot.
Say you’ve deployed an AI forecasting model in part of your supply chain to predict demand and reduce stockouts. It works well in one regional warehouse, so the next step is scaling it across dozens of facilities and thousands of SKUs. That’s where cost per prediction becomes a deciding factor. Some highly performing model architectures require so much compute that running them daily or hourly across the entire network becomes impractical. Others may be slightly less sophisticated but far more efficient, allowing the business to run forecasts more frequently and at a fraction of the cost.
Performance per dollar exposes those differences. It shows whether a model can support the volume and frequency your operations require without inflating budgets or forcing you to limit usage. Sometimes the right model is the one that delivers consistent forecasts at a cost per decision that scales with the business.
AI Model Metrics: Operational Performance
| Metric | What Question Does It Answer? | Business Metrics Impacted | Technical Way of Measuring It |
| Latency | How fast does the AI return an answer? | Customer experience, cycle time, conversion rates, SLAs, support deflection | Time taken per model inference (milliseconds) |
| Throughput | How many decisions can the AI handle at once without slowing down? | Scalability, infrastructure cost, system availability, peak-load performance | Predictions per second (or per minute) under load |
| Performance per Dollar | How much does each model decision cost to run at scale? | OPEX, unit cost per prediction, ROI of deployment, feasibility of enterprise-wide rollout | Cost per inference (compute + memory + infrastructure) |
-
Reliability and fairness
Robustness and Bias — How Well It Handles The Real World
Robustness and bias are often discussed as reliability or responsible AI metrics, but in practice they determine whether performance holds up outside the lab. AI rarely meets the clean, neatly structured data it was trained on In production, real-world inputs arrive messy, inconsistent, outdated, or shaped by regional quirks, and customer groups behave differently across markets.
Robustness measures whether the model still performs reliably when those conditions shift. Bias measures whether the AI treats different groups or contexts consistently, even when those differences weren’t meant to influence decisions. It shows up when the model learns patterns from historical data that unintentionally favor some groups over others, leading to uneven or unfair outcomes once the system scales.
Consider an enterprise rolling out AI to screen candidates during early recruiting stages. Résumés come in thousands of formats: different writing styles, career paths, levels of formality, and regional conventions. A robust system continues making consistent decisions even when the inputs vary widely. A brittle one starts misinterpreting experience simply because layouts or phrasing differ.
When bias shows up, the issue becomes even more serious. The AI may start favoring candidates whose résumés mirror historical patterns, sidelining equally qualified applicants from other backgrounds.A model that behaves well in testing but unpredictably in production is a risk multiplier. Strong robustness and bias controls are what turn an accurate model into a trustworthy one.
Explainability — Can You Trace the Decision?
You should be aware of this concept, particularly if you’re in a regulated industry. Explainability is about whether a model can show why it made a decision, not how often it’s right. Unlike precision or latency, this isn’t a mathematical metric. It’s the ability to surface the factors that drove an outcome and document them in a way your teams can defend.
Some models offer clear insight into which inputs influenced a decision. Others operate as black boxes, delivering strong results with no visibility into the underlying logic. For business leaders, that difference shows up as regulatory risk, the ability to investigate errors, and whether customers and regulators can trust the decision-making process
In healthcare, for example, a triage model that flags a patient as “high risk” must show which symptoms, vitals, or history triggered the alert. Without that traceability, clinicians can’t justify the recommendation or determine whether it’s safe to act on.
The practical question isn’t “is this model explainable?” but “can it produce an audit trail for every high-stakes decision?” In finance, healthcare, and any compliance-heavy environment, a model without explainability is often unusable, regardless of how accurate it is.
AI Model Metrics: Reliability & Fairness
| Metric | What Question Does It Answer? | Business Metrics Impacted | Technical Way of Measuring It |
| Robustness | Does the model stay reliable when real-world conditions get messy? | Operational stability, manual review workload, downtime, decision consistency | Stress-testing accuracy across varied or imperfect inputs (distribution shift tests) |
| Bias | Does the model produce consistent outcomes across different groups? | Regulatory risk, audit findings, brand trust, fairness in hiring, lending, service | Comparing performance and decision patterns across demographic regional, or contextual subgroups |
| Explainability | Can we understand and document why the model made a specific decision? | Regulatory, compliance, customer trust, defensibility of decisions, audit readiness | Feature-importance analysis, model interpretation tools, and generating decision-level audit trails |
Continuous Monitoring Matters
Even when you’ve optimized the right metrics for your use case, AI performance degrades over time. Model drift happens as customer behavior shifts, market conditions change, or new edge cases emerge that weren’t in the training data. Regular monitoring will ensure you catch performance decay before it impacts outcomes.
Model updates (retraining, fine-tuning, or switching to newer versions) reset performance but require re-validation against your business metrics. Fine-tuning base models for your specific use case can improve performance on the metrics that matter most to your business, but even fine-tuned models require ongoing monitoring as conditions change. What worked in January may need adjustment by June.
Performance Metrics Don’t Guarantee Business Success
The metrics above describe how an AI system behaves, but they don’t guarantee it delivers real-world value. A model can perform well on accuracy, latency, or cost and still fail if it solves the wrong problem, introduces friction, or operates too slowly to matter in practice.
In some products, users actively choose whether to rely on AI. In others, AI is embedded so deeply that there is no “adoption” moment at all—the system simply shapes the experience. In both cases, success is measured downstream. Signals like task completion time, error recovery, escalation rates, retention, or user sentiment often reveal more about value than model scores alone.
Ultimately, the real measure of success isn’t how well a model predicts, but whether its performance meaningfully improves outcomes once it’s part of the product or workflow.
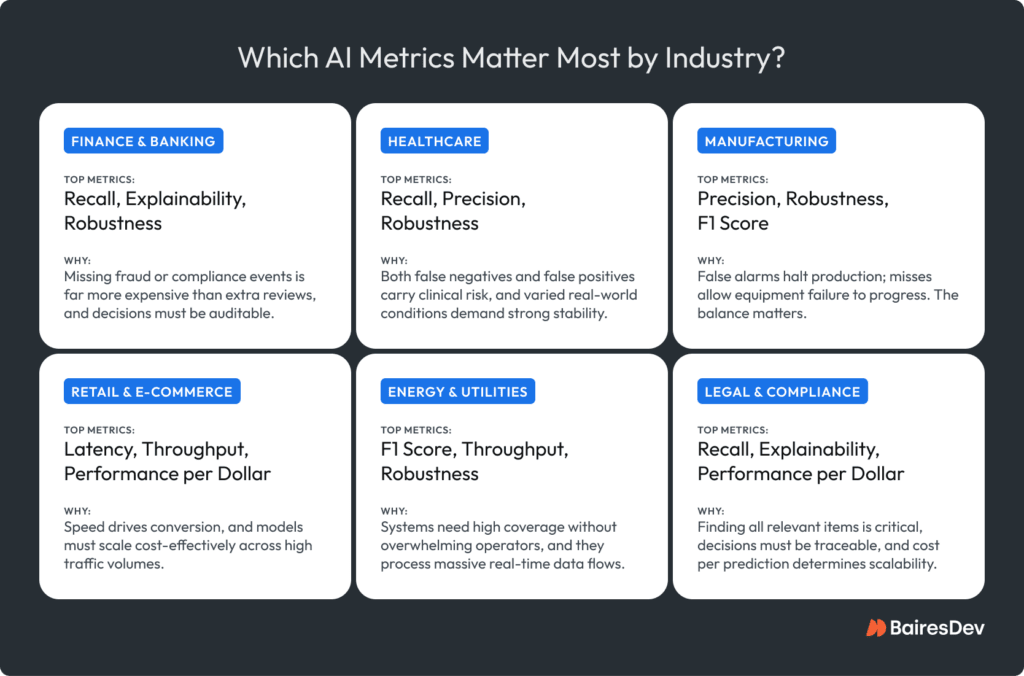
Metrics That Matter Most by Industry
There’s no universal “best” model, only models that make sense in their context. Every industry has its own tolerance for error, speed, and cost, and those differences shape which metrics matter most. The real starting point is understanding what your business and your end users value most. Is it speed? Accuracy? Consistency? Cost control?
As technical leaders, our job is to translate those priorities into the right systems and that means tracking the right metrics from day one. The breakdown below maps the metrics that tend to matter most in each industry.
The Talent That Makes Performance Measurable
If you’re thinking about how to measure AI success, you’re ahead of most organizations. The challenge is usually the ownership. In many teams, no one is explicitly responsible for defining the right metrics, tracking them after deployment, or deciding what to do when performance shifts.
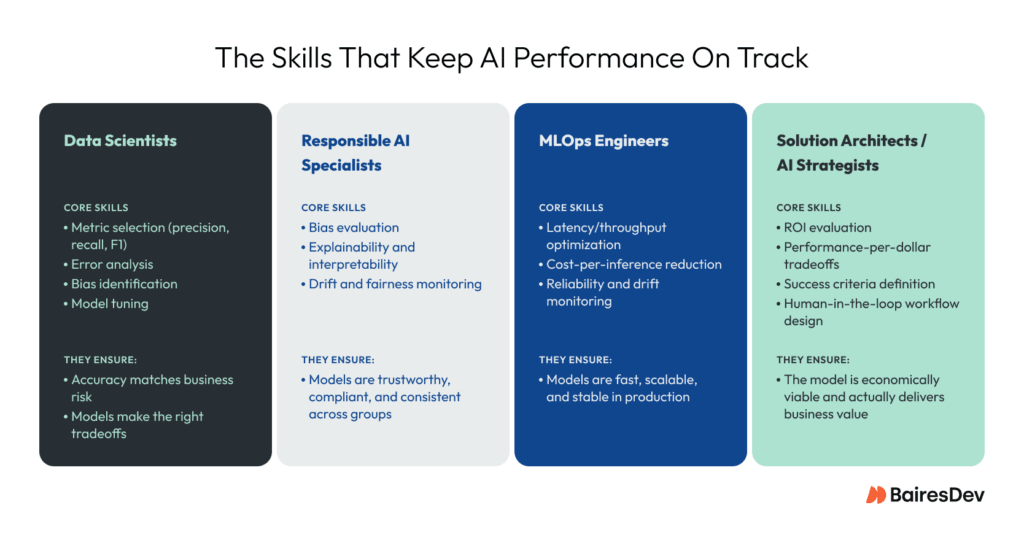
Enterprise AI is a team sport. You need distinct specialists for the math, the infrastructure, and the business logic, not a single “unicorn” who somehow masters all three. The AI teams evaluating your models matter just as much as the metrics themselves.
At BairesDev, we cover the full set of skills needed to evaluate models end-to-end, treating performance not as a metric to hit but as a capability that has to hold up in real production environments.
The Real Goal: Business-Ready AI
AI doesn’t need to be perfect, but needs to perform reliably, quickly, and cost-effectively where it’s actually used. The right metrics show whether a system can meet those demands at scale, across real users, messy inputs, and changing conditions.
For technology leaders, this is ultimately a management problem. When teams track metrics that map directly to business risk, cost, and outcomes, AI systems become easier to govern, easier to improve, and way more predictable over time. Performance isn’t an abstract target. It’s whether the system works the way your business needs it to work.


