

You take a sip of cold coffee and try to still your nerves. You’re staring at your laptop screen, where you see a spike in angry tickets. The loyalty program isn’t working and the CRM dashboard is clogged. Your problem? Weak analytics. When you don’t analyze customer data, you’re flying blind. Meanwhile, you bleed customers without knowing where or why.
Customer analytics gives you a real-time view of customer behavior, from journey drop-offs to engagement peaks. Think of Amazon’s recommendation engine. It’s precision built on segmentation and pattern recognition. Now apply that same logic to tailor marketing campaigns.
Starbucks Rewards doesn’t just offer free drinks. It uses behavioral clustering and feedback loops to push hyper-targeted offers like “Double Star Day.” That’s the right way to turn raw customer demographics data into action. With tagging as filter, you segment and design journeys that actually convert.
What Is Customer Data Analytics?
Customer data analytics is the process of collecting and interpreting customer information like preferences and purchase history, then using it to shape more informed business decisions. It turns raw data into insight. That lets you spot patterns and target customers.
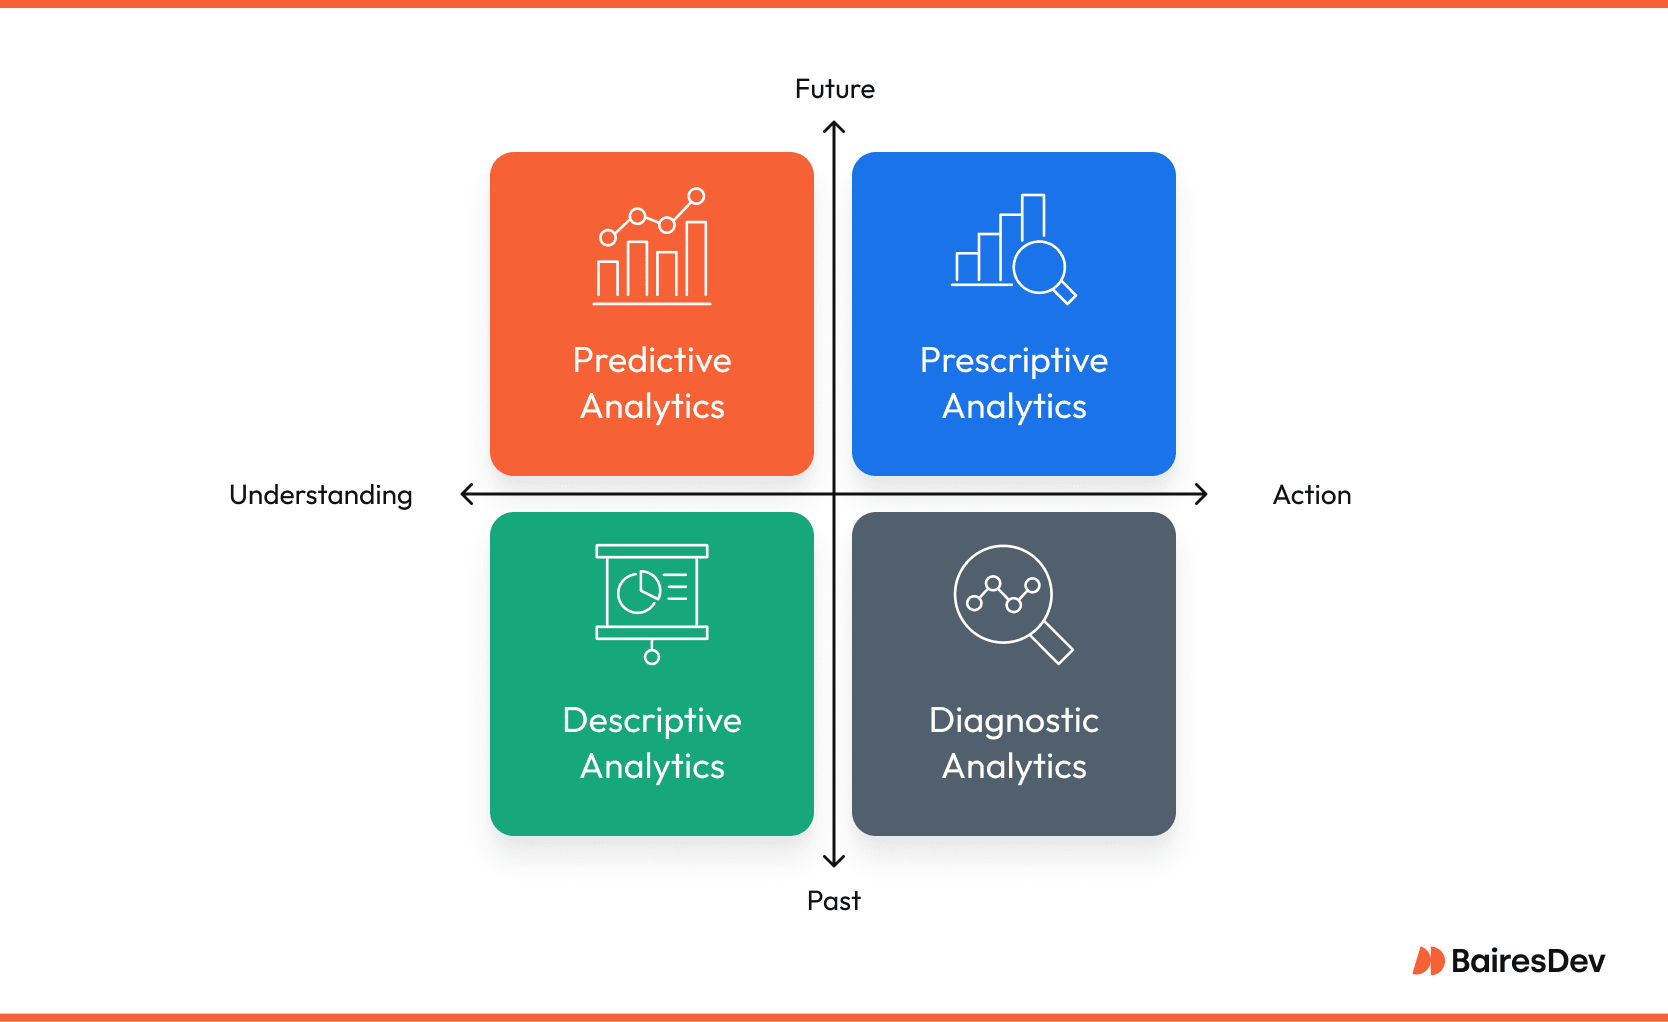
There are four main types of customer analytics:
- Descriptive analytics: Understand what happened using dashboards and trend lines.
- Diagnostic analytics: Dig into why it happened through segmentation and attribution models.
- Predictive analytics: Use predictive modeling to forecast.
- Prescriptive analytics: Recommend what to do with rule-based logic.
How it Works
Analytics let you build smarter marketing strategies and personalized marketing campaigns. You’ll start tailoring offers based on key performance indicators.
For example, Adobe Analytics maps the full customer journey across web and mobile. That helps teams monitor customer sentiment and refine their touchpoints.
Use Cases and Metrics
Effective customer analytics starts with understanding what type of data to analyze and why. When you apply the right framework, you get better data insights from onboarding to churn. The table below shows the types of customer analytics. From reworking loyalty programs to analyzing purchase history, each type helps improve customer retention.
These analytics are all different ways to show how customers interact with your brand. Pair each strategy with segmentation to separate insight from noise.
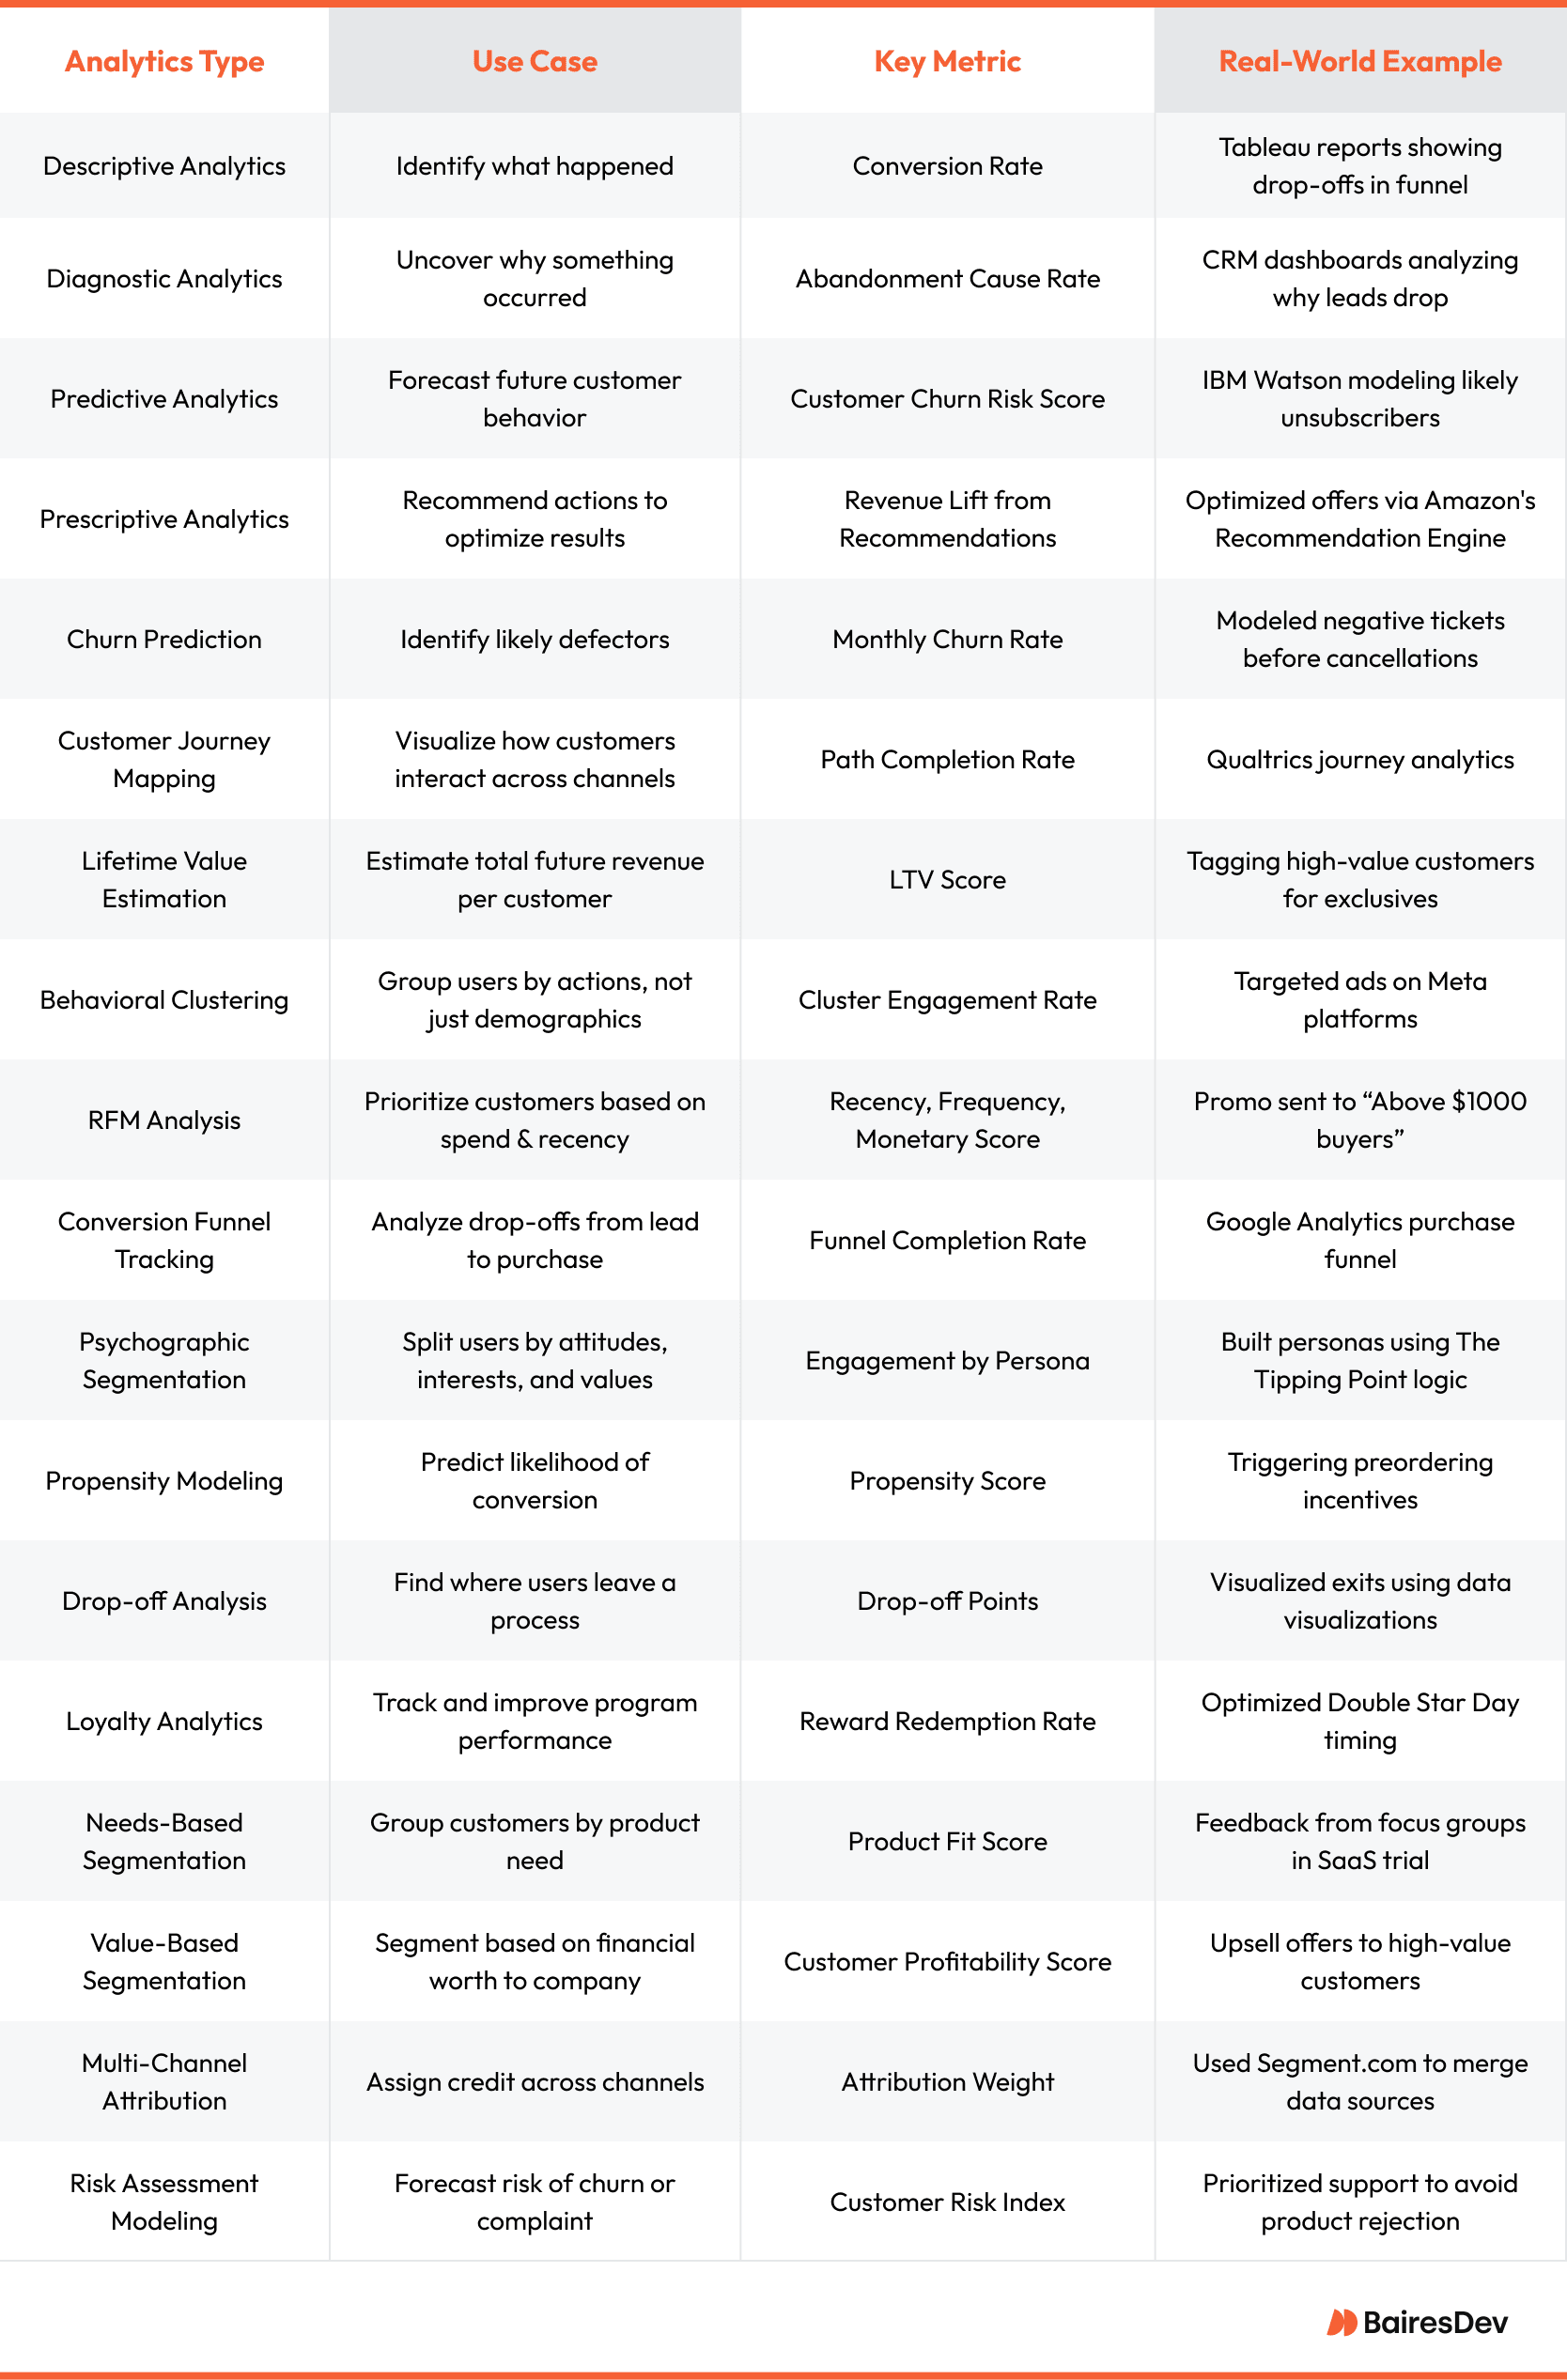
Types of Customer Analytics
Netflix once paid $1M for a model that flopped in the real world. To make customer analytics work, you need to match the method to the problem and the business goal. Below, we unpack how different analytics types track, deliver, and activate insights that power strategy.
Descriptive Analytics
Descriptive analytics shows what already happened. It surfaces trends and behaviors so you’re not fumbling in the dark. It works via dashboards and visualizations that summarize the past.
Use tools like Tableau or your CRM to track page views, and conversion rates. This is your baseline: the “what” before the “why.” Descriptive analytics doesn’t predict or explain. It just lays the groundwork. Use it weekly to monitor patterns, then dig deeper when something spikes or slumps.
For example, a retail brand might use Tableau to visualize a sudden drop in checkout completions during a weekend sale, flagging a technical issue before it costs thousands.
Diagnostic Analytics
Diagnostic analytics helps you understand why something happened. It digs into causes and user paths to explain drop-offs or engagement shifts. It’s the “why” behind the “what.”
Use customer analytics tools like Segment or Splunk to trace back user actions and spot friction points. Layer tagging to isolate patterns, like who’s abandoning carts mid-flow.
For example, a SaaS company might discover through diagnostic customer analytics that trial users drop off after hitting a confusing onboarding step. Based on that, they might decide to do a UX overhaul.
Predictive Analytics
Predictive analytics forecasts what your customers are likely to do next. It uses machine learning and historical data to estimate churn or lifetime value.
With customer analytics platforms like IBM Watson or Amazon’s engine, you can model future outcomes to shift your strategy. Just beware of overfitting. Your model should evolve with customer shifts.
For example, a subscription service might use predictive customer analytics to flag users with declining engagement. They may offer a preemptive retention incentive to head off cancelations.
Prescriptive Analytics
Prescriptive analytics recommends what to do next. It can suggest the best offers or messaging based on rule-based logic.
Adobe Sensei and Salesforce are key analytics platforms that can suggest when to upsell or who should get a limited-time offer.
For example, a travel brand might use prescriptive customer analytics to push tailored flight deals based on timing and past destination preferences.
Churn Prediction
Churn prediction identifies customers who are at risk of leaving. It analyzes customer data like support history and product usage to forecast defection.
Platforms like Qualtrics and certain custom Salesforce models help flag early warning signs. These could be repeated complaints or a sudden dip in logins. Combine churn risk with labeling to boost re-engagement.
For instance, a fintech company might use churn prediction from customer behavior data to detect when valued users stop using key features. It could then send a personalized check-in before they exit.
Customer Journey Mapping
Customer journey mapping visualizes how users interact with your brand across touchpoints like mobile or support. It helps you identify friction and improve experience.
Customer analytics tools like Adobe Analytics let you track behaviors from onboarding to conversion. This turns scattered customer data into a map of user intent.
Case in point, a brand might uncover through journey mapping that users drop off right after adding items to the cart. That shows they need to simplify their checkout process.
Lifetime Value Estimation
Lifetime value (LTV) estimation predicts the total revenue a customer will generate. It helps prioritize customer segments and focus retention efforts.
Customer analytics apps like Excel Power Query calculate LTV using past spend and customer engagement. Flagging top earners lets you build exclusives or early access into your loyalty strategy.
Let’s say your LTV model highlights that a small segment drives 60% of profit. You now know exactly who to protect and reward.
Behavioral Clustering
Behavioral clustering segments users by patterns like session depth or feature usage.
Segment and Meta’s ad tools let you run clustering models that surface engagement-driven groups. Tag those clusters to tailor offers, retarget lapsed users, or time promos with precision.
Take Starbucks: its Double Star Day isn’t random. It’s fueled by clustering to nudge frequent visitors when they’re most likely to buy.
RFM Analysis
RFM (Recency/Frequency/Monetary) analysis ranks customers based on how often they purchase and how much they spend. It’s a fast way to find loyalists and dormant segments.
Use customer analytics platforms like Tableau or Excel Power Query to score users and tag segments. For example, “big spenders” or “at-risk repeat buyers.” RFM helps you focus offers where they’ll have the most impact.
A DTC brand might send a high-discount promo only to users with low recency scores. Meanwhile, they might reward frequent, high-value buyers with early access.
Conversion Funnel Tracking
Conversion funnel tracking analyzes each stage of the customer journey. It pinpoints where users drop off so you can shrink the path to revenue.
By collecting data from your CRM, these analytics let you visualize bottlenecks. You can then A/B test copy or layout at the point of friction.
Say your funnel shows 40% of users exit right after viewing pricing. That’s your cue to clarify value or add a confidence-builder like testimonials.
Psychographic Segmentation
Psychographic segmentation divides customers by attitudes and values. It helps craft messaging that resonates with their emotions.
This type of analytics starts with analyzing user behavior using surveys and customer feedback. Use custom persona frameworks to build nuanced segments.
Spotify Wrapped is a great example. It uses personality profiling that boosts loyalty through emotional alignment.
Propensity Modeling
Propensity modeling predicts how likely it is that a customer will do something like buy or unsubscribe. It shows us when and how to intervene.
Tools like Amazon Personalize use these analytics to initiate timely offers or nudges.
Picture this: you identify users with a high propensity to preorder. A limited-time incentive sent to that group can drive revenue without discounting across the board.
Drop-off Analysis
Drop-off analysis finds the moment when users abandon a process. It helps you plug leaks that kill conversions.
Tools like Google Analytics or Mixpanel visualize these exit points. Teams implementing analytics like this can spot UX friction or broken CTAs before they lose revenue.
An e-commerce brand saw a spike in exits after users added items to the cart. Drop-off analysis revealed a surprise: shipping costs weren’t shown until the final step.
Loyalty Analytics
Loyalty analytics tracks how customers engage with your rewards program. It might measure how often they redeem or what they ignore. It turns passive programs into active retention engines.
Qualtrics can show loyalty trends and make adjustments. Teams use these customer analytics to time offers or personalize perks based on patterns.
A coffee chain might spot a dip in redemptions, then launch a Monday-only bonus to reignite habit loops.
Needs-Based Segmentation
Needs-based segmentation groups customers by what they’re trying to accomplish. It focuses on motivations and product fit.
Platforms like Salesforce can capture survey responses or support queries to uncover unmet needs. By analyzing customer segments this way, you can align messaging with user goals.
A SaaS company, for example, might see trial users in two segments: one seeking automation and the other insights. Each gets a tailored onboarding path.
Value-Based Segmentation
Value-based segmentation ranks customers by their financial impact, such as revenue. It helps you focus resources where they drive the most return.
Marketers can use platforms like Tableau or HubSpot to slice segments by LTV, profit contribution, or purchase velocity. This lets you understand customer behavior in terms of business value.
Say your data shows a small group generates outsized profit but rarely uses discounts. You can skip promos for them and offer exclusives instead.
Multi-Channel Attribution
Multi-channel attribution assigns credit across touchpoints like ads or emails. They show you what actually drives conversions. That helps eliminate guesswork in marketing campaigns.
Tools like Segment or Adobe Analytics connect customer actions. Analyzing those paths reveals valuable insights into combinations that move the needle.
Imagine learning that users who see an email after a social ad are twice as likely to convert. That’s attribution done right.
Risk Assessment Modeling
Risk assessment modeling forecasts which customers are likely to churn. It lets you get ahead of problems instead of just reacting.
Teams can build early warning systems by analyzing different types of data like support tickets or engagement dips,. Tools like Salesforce prioritize high-risk users for faster outreach and support.
An enterprise SaaS team might flag accounts with repeated bugs logged and lower NPS scores, then assign proactive success calls before renewal time.
Why Analytics Moves the Needle
You just launched a campaign and you already see a 22% lift in conversions. Churn’s down too, because high-risk customers got early access to a loyalty perk. Your team is acting on good data. It works because you nailed your campaign optimization. Here are five benefits of customer analytics:
- Smarter Customer Segmentation: Build precise customer segments.
- Personalized Experiences: Deliver relevant content and offers. Automate messaging with behavior and preferences.
- Churn Prediction: Analyze customer data to flag risk.
- Campaign Optimization: Use customer analytics to refine marketing campaigns based on conversion trends.
- Loyalty Program Performance: Rework programs using customer data analysis. Increase customer lifetime value.
How to Turn Data Into ROI
Most companies already have the data. They just don’t use it right. Here’s how to turn raw numbers into ROI.
- Collect Multi-Channel Data: Pull customer actions from web or customer relationship management to build a complete picture.
- Clean and Organize Inputs: Remove duplicates, tag key actions, and format types of customer data for analysis.
- Segment by Behavior: Group users by actions and value to identify what drives performance.
- Apply Predictive Models: Forecast churn and customer lifetime value using past patterns.
- Trigger Personalized Journeys: Use workflows to send the right message or incentive at the right time.
- Measure and Recalibrate: Track KPIs and adjust campaigns monthly to keep performance aligned.
Where Analytics Break Down
You won’t know just by looking at the table. Most teams have plenty of customer data—but without structure, it creates confusion instead of clarity.
- Bad Inputs, Bad Outcomes: Poor-quality data leads to bad decisions. Regularly audit and validate data.
- Model Bias and Overfitting: Overtrained models and narrow data sets skew results. Retrain models quarterly and pair predictions with human review.
- Siloed Insights: Cata in separate systems misses the full picture. Integrate platforms and create shared dashboards.
- Tool Overload: Too many dashboards lead to noise. Align tool use with a single analytics plan.
Frequently Asked Questions
What industries benefit most from customer data analytics?
E-commerce, SaaS, retail, and healthcare all use customer data analysis to improve personalization and customer satisfaction.
How do I start implementing customer analytics without a full data team?
Start small. Use CRM tagging and simple dashboards to track key data, then scale as insights grow.
How often should I refresh my customer data?
Review and clean data monthly to maintain accuracy and ensure your analytics reflect current behavior.
What’s the best way to calculate customer lifetime value?
Use purchase history and churn rate to estimate customer lifetime value. Then prioritize valued customer segments.
Can small businesses use customer analytics effectively?
Yes. Affordable tools like HubSpot or Google Analytics make analytics accessible even without enterprise-level resources.


