

When engineering leaders talk about data analysis and data visualization strategy, the conversation usually starts with a simple question: Should we use Power BI or Tableau? But what they really want to know is: How do we deliver reliable, governed, and cost-controlled data analytics at scale, without drowning in dashboards?
For mid-sized enterprises, data analytics platforms aren’t just reporting tools for data analysis. They are extensions of the engineering stack. They must connect securely to data sources, integrate with CI/CD workflows, support versioning, and operate under governance controls.
This article explores how to evaluate and operate Power BI and Tableau in that context.
Power BI and Tableau: Different Histories, Same Enterprise Pressure
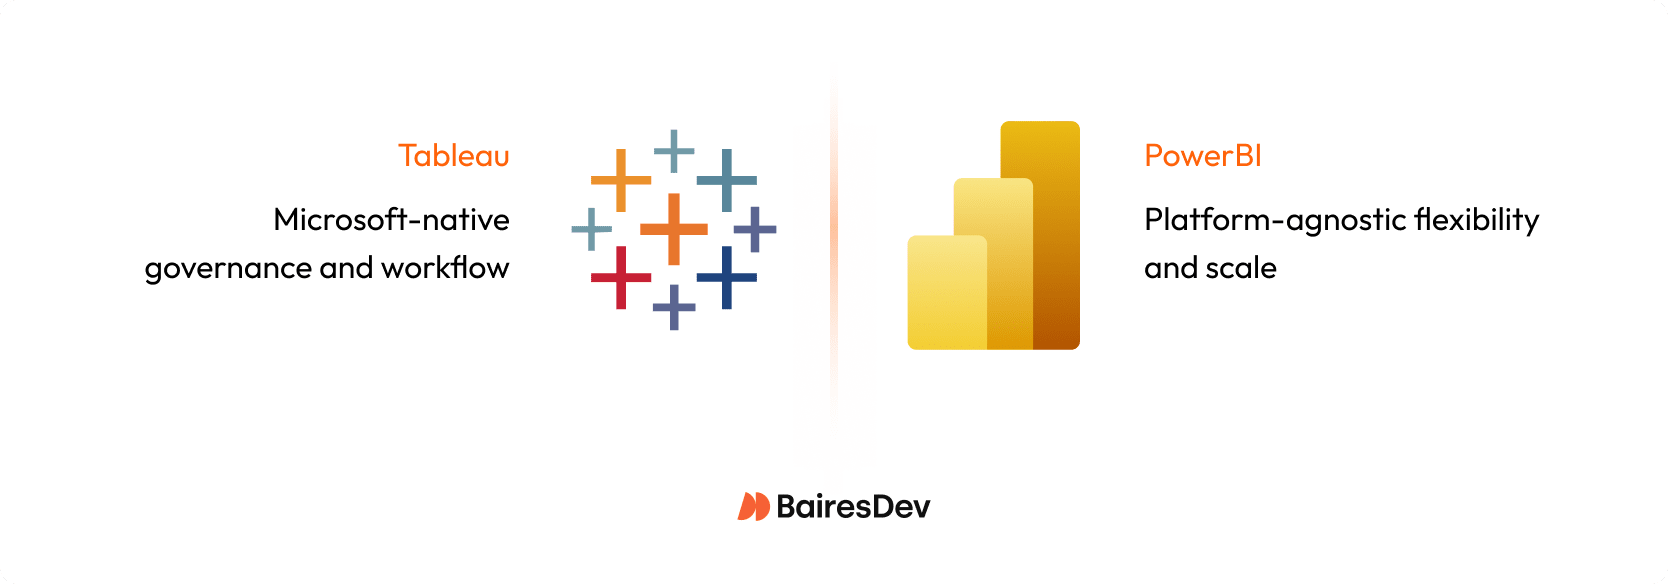
Power BI and Tableau grew from different lineages. Power BI was built as part of the Microsoft ecosystem, while Tableau started in academia, designed for open-ended exploration and storytelling with data.
Today, both compete directly for the same enterprise workloads. Each has mature governance and deployment features, but the fit depends on your environment. Power BI often feels natural for organizations already committed to Microsoft infrastructure. Tableau’s flexibility tends to appeal to teams with multiple clouds, varied data platforms, or stronger data visualization needs.
The decision is not really which tool is better. It is which tool fits the way your engineering organization delivers data analytics and supports decision making?
Governance and Security: Where Scale begins
Every successful business intelligence (BI) analytics program begins with governance, not dashboards.
Power BI’s advantage is its integration with Microsoft Entra ID (formerly Azure AD), which gives engineering teams centralized identity, multifactor authentication, and row- or column-level security out of the box. In the Power BI service, Entra ID groups enforce workspace access, RLS/CLS, and sharing. Workspaces, databases, and content can be tied to Microsoft 365 groups, which simplifies permission management.
Tableau handles security differently. It separates data governance from content governance. That means the same permissions model that governs your data sources doesn’t automatically control who can see or modify dashboards. This can be liberating in small teams but risky without a governance plan. Tableau’s Blueprint framework provides a governance maturity model and guidance on how to define roles for data stewards, site admins, and content owners, but it’s your operating model that closes the gap.
In practice, Power BI tends to reduce integration work if your identity system already runs on Microsoft. Tableau gives more flexibility when you need to federate identities across multiple sources or clouds. Both can meet enterprise security standards, but success depends on whether your engineering team has the operational discipline to maintain those controls over time.
The Semantic Layer: Keeping Metrics Consistent
One of the most common risks in enterprise data analytics is metric drift, where key terms like “revenue”, “conversion”, or “active user” are defined differently across dashboards.
Power BI handles this with reusable semantic models. A single certified dataset can feed hundreds of reports, ensuring consistent definitions. That model, often built using a Power BI data flow, can live in a workspace governed by your data engineering team and referenced by business units who build their own dashboards.
Tableau takes a looser approach. Authors can build extracts or connect live to raw data sources. Without oversight, that freedom to connect to and transform raw data creates duplicate calculations and inconsistent KPIs. Tableau’s Data Management helps by introducing shared data sources and virtual connections, but the discipline must come from your operating model.
In short, Power BI enforces governance through structure; Tableau relies on process. Choose based on your organization’s maturity. If you already have an established semantic layer or database tool transformation pipeline, Tableau can plug in cleanly. If you’re still consolidating data definitions, Power BI’s guardrails can save you from yourself.
Performance and Data Connectivity
Large enterprises rarely have the luxury of a single data warehouse. Most have a lakehouse, a warehouse, and multiple operational databases (like SQL Server or Postgres) for their business intelligence tool to consume.
Power BI can connect to all of these, but performance depends heavily on mode. To connect and transform data, Power BI supports Import and DirectQuery. Pick the mode per workload. Import mode caches data in Microsoft’s VertiPaq engine, which is fast but constrained by large data sets and refresh limits. DirectQuery allows real-time queries but can bottleneck if the backend isn’t optimized.
Tableau’s Hyper engine is designed for fast extracts and handles large datasets and complex joins well, but the use of extracts introduces governance challenges: each extract (often built with tools like Tableau Prep) must be stored, refreshed on a schedule, and governed for lineage, ownership and duplication.
With extract-based architectures, engineering teams must include governance of the extract layer as a first-class concern. Without processes to catalogue extracts, retire unused snapshots, enforce refresh SLAs and maintain lineage back to source systems, you risk stale data, duplicate calculations and uncontrolled storage growth.
The best engineering practice is to minimize data movement. Build a strong data platform and treat both BI tools as consumers of a shared semantic layer. Avoid building heavy transformations or complex data preparation inside the BI tools themselves. That’s how you keep data analytics performance predictable and maintainable.
DevOps and Lifecycle Management
Data analytics needs Devops as much as application code does.
Power BI supports deployment pipelines for promoting content from development to test to production. Modeling and authoring typically start in Power BI Desktop before publish. PowerBI integrates with Git for version control and supports CI/CD workflows through Azure DevOps or GitHub Actions.
Tableau offers similar features (often starting from Tableau Desktop) through the Tableau Server REST API and the Tableau Content Migration Tool. However, these require more scripting and infrastructure management. The trade-off is flexibility: Tableau can run in hybrid and multi-cloud setups where Power BI’s managed service model might not fit.
What matters most is that your BI lifecycle aligns with your existing engineering practices. Dashboards should move through controlled environments, pass tests for performance and data accuracy, and be versioned like any other production artifact.
Collaboration and Distribution
How analytics dashboards are shared and consumed across the organization can have as much impact on adoption and trust as the dashboards themselves.
Power BI integrates deeply with Microsoft 365. Sharing through Microsoft Teams or embedding dashboards in SharePoint or Office apps requires almost no additional setup. For organizations where those tools are already standard, integrating Power BI can be seamless.
Tableau excels at web and embedded experiences. It offers granular control over how interactive visualizations are published, customized, and embedded into customer-facing applications. Tableau’s storytelling and presentation features are also more advanced, which matters when executives depend on data visualization to communicate strategy, not just track metrics.
The engineering trade-off is operational overhead. Power BI’s distribution is simple but tied to Microsoft’s ecosystem. Tableau’s analytics service is more flexible but often needs more admin effort.
Cost and Observability
Both platforms can become expensive if left unmonitored.
Power BI’s cost depends on licensing and capacity. Individual user licenses are relatively affordable, but scaling to enterprise workloads often requires Power BI Premium features, which can be billed per user or per capacity. Without monitoring usage and refresh patterns, organizations risk over-provisioning and paying for resources they don’t fully use, so early visibility into adoption and performance is important for controlling costs.
Tableau’s subscription pricing is more predictable but typically higher per user. It also requires infrastructure management if you self-host Tableau Server.
The best defense is observability. Track dataset refresh times, report usage, and user adoption. Retire dashboards that go unused for months. Charge capacity costs back to business units. Treat your BI environment as a shared service with quotas and budgets, not as a bottomless dashboard pool.
When Both Tools Coexist
Many organizations discover they can’t pick just one.
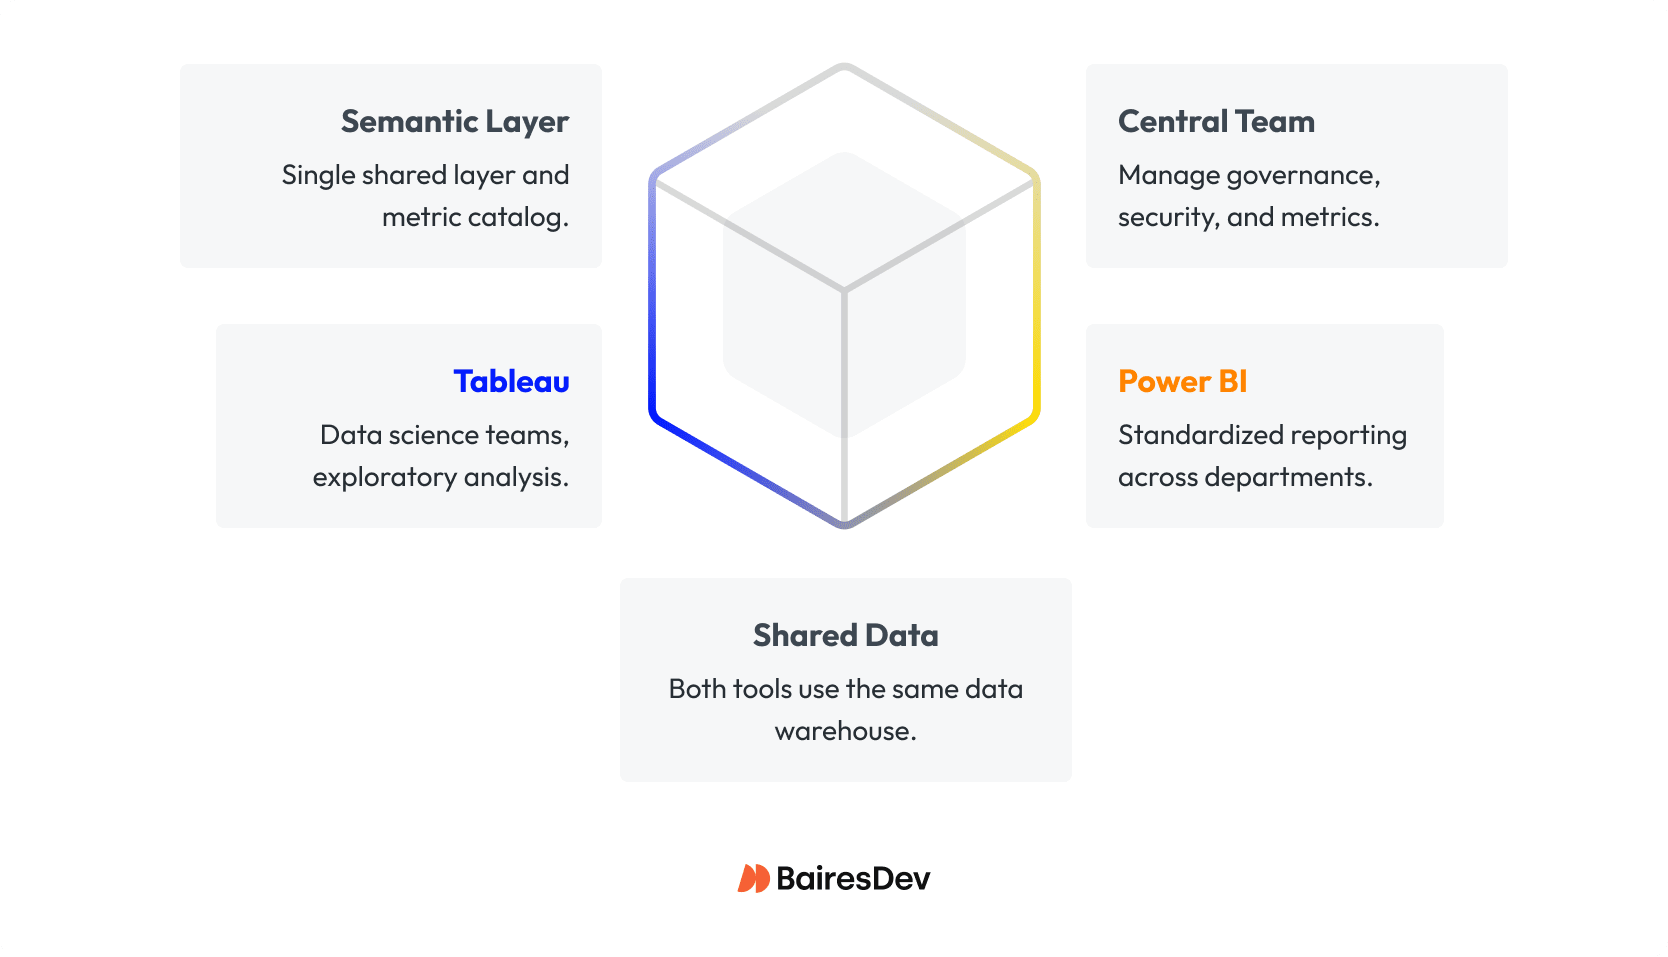
Engineering teams often deploy Power BI for standardized reporting across departments, while Tableau remains the tool of choice for data analytics and data science teams that need to perform data analysis and deeper exploration.
This coexistence can work if both tools pull from the same data warehouse and share a semantic layer. A central governance team defines metrics and access rules, while different teams choose the data visualization surface that fits their workflow.
The danger comes when each tool builds its own data models. That’s how metric drift and duplicate costs appear. The mitigation is straightforward: one semantic layer, one metric catalog, consistent security, and a planned schedule for updates and maintenance of key dashboards.
If you’re migrating from one tool to another, set up a “migration factory.” Audit existing dashboards, identify which ones deliver value, retire duplicates, and refactor the rest to fit the new model. Resist the temptation to lift-and-shift everything; it only carries technical debt forward.
Building the Operating Model
The tool you choose matters less than how you run it. A well-run analytics platform has a clear operating model.
A central data engineering team maintains the pipelines and warehouse. Data analytics engineers own the semantic layer and certified datasets. Business analyst and data analyst teams create dashboards from those assets. Governance committees review new reports, certify production dashboards, and retire outdated ones.
Support functions are part of that same ecosystem. Without training and documentations, even the best-designed data analytics stack degenerates into dashboard sprawl.
Success metrics for analytics should mirror those in platform engineering: reliability, velocity, and cost efficiency. Track how long it takes to move a new dashboard from request to production. Monitor refresh success rates and latency. Evaluate adoption and proficiency, not just report counts.
Learning and Skills
Data analytics tools succeed or fail based on the user’s data visualization skill.
Power BI is the natural first step for teams who already live in Excel. The transition is fast, and the DAX language builds on familiar concepts.
Tableau demands more design sense and data literacy to visualize data effectively, but rewards users with creative freedom. It’s better suited for teams that need to explore data, not just visualize predefined KPIs.
For engineering and data teams, the most valuable skills are tool-agnostic: data modeling, SQL performance tuning, version control, CI/CD, and governance. Cross training analysts and engineers across both tools reduces lock-in and gives you flexibility when vendors change licensing or pricing models.
Risk and Mitigation
Every analytics program carries risks that resemble those in software delivery. Metric drift mirrors code drift. Security misconfigurations can expose sensitive data. Unoptimized models degrade performance.
The mitigation strategy is familiar to engineering leaders: treat BI like production software. Version your models. Test your dashboards. Audit permissions. Track usage and retire dead code.
Vendor lock-in is harder to eliminate, but cross-training and a well-defined semantic layer can reduce dependency on any single tool. If you ever migrate, your metrics and models should survive the transition intact.
Making the Decision
The real decision isn’t “Power BI of Tableau”. It is about architecture, governance, and cost alignment.
If your enterprise is Microsoft-first, with existing Azure infrastructure and Excel power users, Power BI will integrate cleanly and cost less to operate.
If your environment is multi-cloud or includes teams that depend on open-ended exploration, Tableau may deliver more value.
Some organizations will need both. In that case, keep a single data foundation, define clear ownership, and measure cost and adoption across tools. Governance should not end at business tool boundaries.
Whatever you choose, make it deliberate. Data analytics is an engineering discipline. Although the business analytics service provided by a vendor can enhance its effectiveness, the fundamentals remain constant.
| Dimension | Power BI | Tableau | When to Choose / Engineering Takeaway |
| Governance & Security | Strong Microsoft integration; built-in workspace and data governance | Flexible but relies on process; Blueprint framework helps | Choose Power BI if you need enforced governance out-of-the-box; Tableau for flexible, multi-cloud environments with disciplined processes |
| Semantic Layer & Metrics | Certified datasets prevent metric drift; reusable calculations | Flexible data modeling; risk of duplicates without centralization | Power BI for standardized reporting; Tableau for exploratory analytics with controlled semantic layer |
| Performance & Data Connectivity | Fast for imports; DirectQuery depends on backend | Hyper extracts handle large datasets; extract refresh & governance overhead | Both require strong central data platforms; monitor refresh schedules and extract lifecycle |
| Collaboration & Distribution | Seamless for Microsoft 365/Teams/SharePoint | Rich embedded web experiences; more admin overhead | Power BI for internal, Microsoft-centric orgs; Tableau for flexible embedding and storytelling |
| Cost & Observability | Per-user or per-capacity; risk of over-provisioning without monitoring | Higher per-user cost; self-hosting adds infrastructure overhead | Monitor usage and refresh patterns early to control costs |
| Coexistence / Fit | Standardized dashboards across departments | Advanced data visualizations, exploration | Coexistence works if both share a semantic layer; clear ownership and migration planning are essential |
What I’ve Seen as a Product Designer
After more than 15 years in product teams and plenty of hands-on time with both Power BI and Tableau, I keep seeing the same patterns in serious analytics rollouts.
Self-service is never just a tooling decision. You can activate licenses and connect data sources, but unless the organization is genuinely committed to using data in decisions, with clear analytical roles, basic enablement, and leadership expectations, self-service analytics does not stick. The tools merely accelerate what the culture already supports.
Both platforms also depend on the semantic layer and shared definitions. So what happens if teams cannot agree on key concepts like active user, conversion, or revenue? With no alignment, the BI layer will only make your inconsistences more visible. Getting stakeholders aligned early on terminology and architecture gives you a foundation for reliable performance and fewer conflicts over which metric should be used.
Governance is what makes this approach scale. When roles, permissions, and certified data sources are clearly defined and maintained, you can safely decentralize dashboard creation to product and business teams. Central data and engineering groups focus on the platform and the semantic layer while everyone else builds on top of that with guardrails.
In the end, data maturity is less about tools or dashboards and more about trust. When people trust the data, they ask better questions and ship better products. When design, engineering, and analytics move in step, data becomes the thing everyone can agree on, not the thing everyone fights over.


