

As engineering organizations scale, visibility into delivery progress becomes harder for leaders to maintain. We often rely on scattered reports or lagging indicators to understand delivery, business health, team capacity, or roadmap alignment.
Strategic key performance indicators (KPIs) bring clarity, offering real-time insight that supports faster, more confident decision-making at scale.
What KPIs Mean at the Leadership Level
KPIs are a quantifiable measure of an organization’s success in achieving its business objectives. For senior engineering leaders, the relevant KPIs are less about daily activity and more about visibility into whether teams are delivering real business outcomes and contributing to overall strategic goals.
KPIs connect high-level business strategy to execution by quantifying progress in areas like velocity, quality, capacity, and stability. A well-structured KPI system turns engineering work into data that leadership can use to make informed, timely decisions.
Unlike operational performance indicators used by team leads or scrum masters, leadership KPIs bring to light broader patterns and risks. For example, business metrics like deployment frequency, defect escape rate, or lead time for changes can help you assess delivery efficiency across multiple teams. Sprint throughput trends can inform hiring or reprioritization discussions. Service reliability metrics (like mean time to recovery) show how well the organization is handling scale or complexity.
More importantly, at this level, the relevant KPIs are tied to business impact. It’s not enough to track tickets closed or bugs resolved. Those numbers must roll up to strategic goals such as faster time-to-market, better customer experience, or lower churn. When KPIs are structured this way, they become tools not just for monitoring actual performance, but for shaping decisions about resources, scope, and roadmap tradeoffs.
When You’ve Outgrown Spreadsheets
Spreadsheets work—until they don’t. For early-stage teams or small initiatives, manual tracking may be enough. But as engineering organizations grow, complexity multiplies: more teams, more systems, more performance measures. At a certain point, spreadsheets become a bottleneck instead of a solution.
The signs are usually clear. You’re spending more time consolidating reports than acting on them. Leaders can’t drill into key metrics without asking someone to pull a new view. Teams are working from different versions of the same file. Review cycles lag behind the pace of development. Manual tools also struggle to handle more complex financial metrics or calculate trends like cash flow or cost variance in real time. And by the time you surface a red flag, it’s already a downstream problem.
Inconsistent data collection is another signal that you’ve outgrown your tracker. Without automated pipelines or standardized inputs, KPI reports quickly become unreliable, even misleading, undermining trust. This also makes it harder to use metrics in executive discussions or cross-functional planning.
A robust KPI system solves for these issues by automating data collection, standardizing definitions, and enabling real-time visibility across the organization. Instead of manually curating static KPI reports, leaders can explore interactive KPI dashboards, segment by team or region, and drill down into delivery trends or risk indicators as needed. The shift from static to dynamic, from reactive to proactive, is a key step in building a data-driven engineering org that can operate at scale.
Build vs. Buy: Choosing the Right KPI Management System
When it’s time to adopt a KPI solution, leaders must consider whether to adopt an existing KPI tool or build a custom system tailored to the organization’s needs. Each path has tradeoffs in speed, flexibility, long-term maintainability, and actual cost.
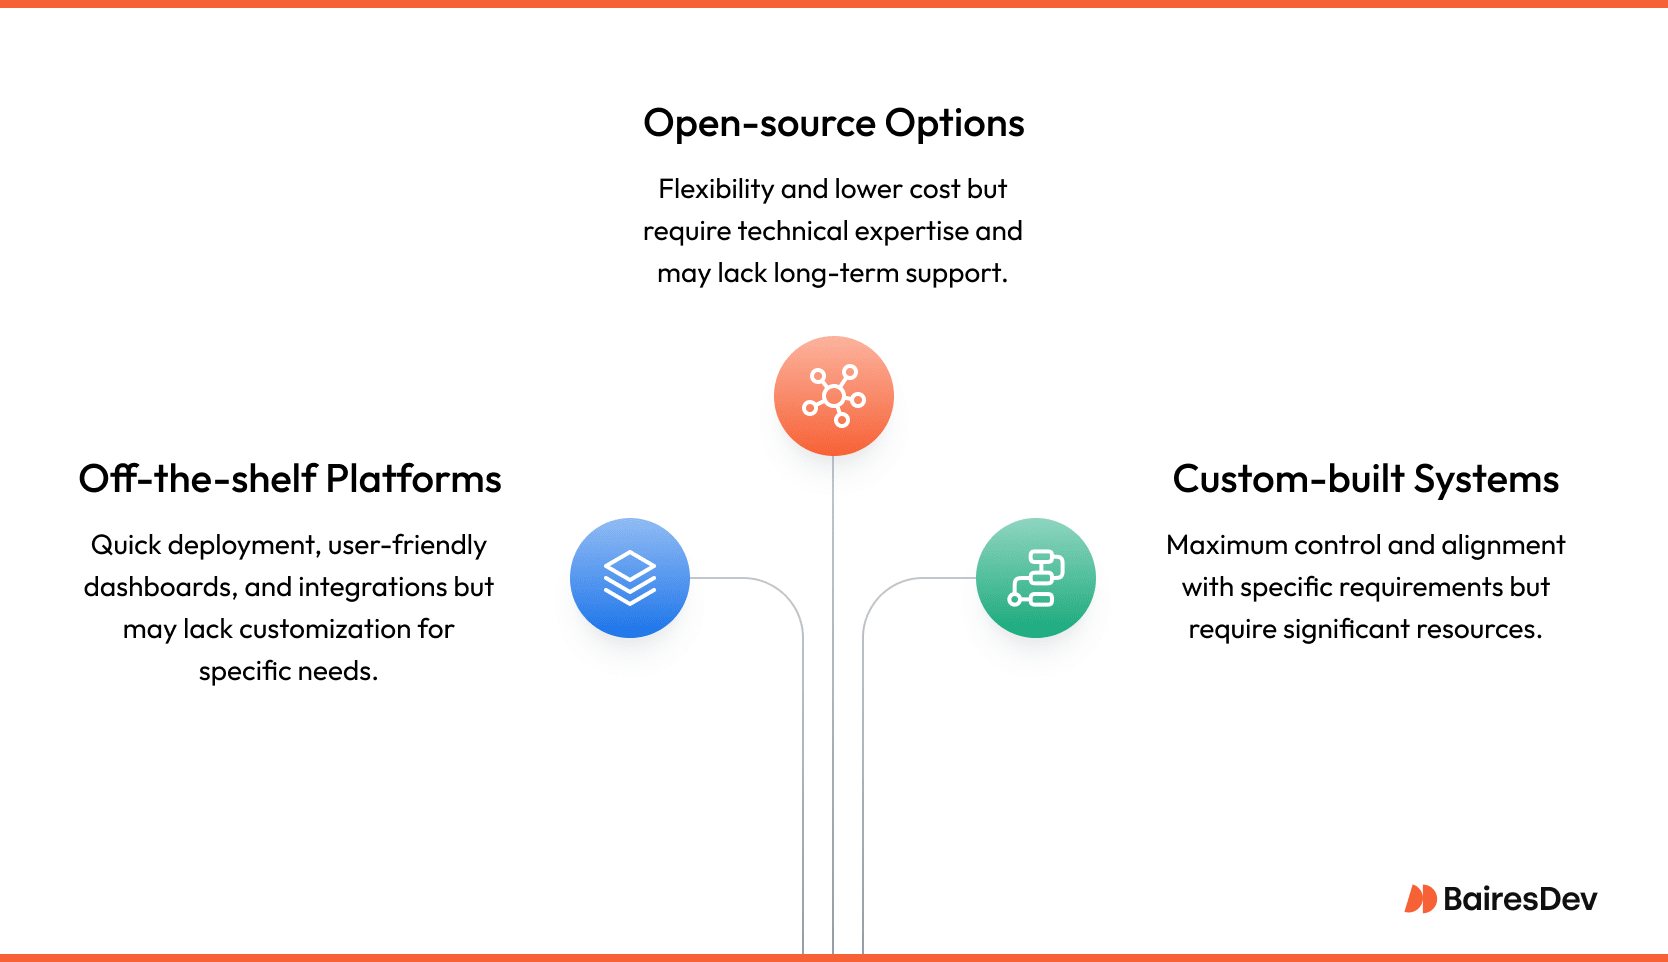
Off-the-shelf KPI solutions
Off-the-shelf platforms (e.g., Power BI, Looker, Tableau) offer quick deployment, user-friendly dashboards, and an ever-growing library of integrations with tools like Jira, GitHub, Datadog, and Salesforce.
For companies with standard business metric needs, they’re often sufficient. These tools typically include role-based access, alerting, and basic drill-down features. Organizations focused on customer KPIs or regulatory constraints often require more customization than off-the-shelf tools provide.
Open-source options
Open-source solutions offer more flexibility at a lower cost but require in-house technical expertise to implement, secure, and maintain. They’re best suited to organizations with strong DevOps or data engineering capabilities and the desire to own the stack.
However, long-term support and integration maturity can vary widely between projects. Additionally, open-source tools may suffice for tracking basic performance indicators but often fall short for more strategic reporting like gross profit margin or net profit margin.
Custom-built KPI systems
Custom-built systems provide maximum control, especially when unique workflows or domain-specific metrics are involved. These platforms can be built to fully align with your architecture, security posture, compliance requirements, and internal vocabulary. You can define role-based views for engineering managers, executive dashboards for VPs, and filters for geography, product line, or customer segment.
This is especially valuable for regulated industries or companies with unique delivery models. Custom-built KPI systems require initial development time, ongoing maintenance, and dedicated resources to evolve the system alongside your business.
The right choice depends on your internal capabilities, urgency, and the complexity of your reporting needs. Many large organizations start with off-the-shelf tools and gradually evolve toward hybrid or custom solutions as KPI maturity increases. Regardless of the path, the goal remains the same: make business performance visible, actionable, and aligned to strategic priorities across the business.
Implementation Considerations for Enterprise Leaders
Rolling out a KPI system across a growing engineering org is a strategic initiative. Getting it right requires alignment, participation, clear expectations, and disciplined outcome reviews across the organization. Before rollout, it’s critical to develop KPIs that reflect both team-level delivery and strategic impact.
Strategic Alignment
Every KPI should be a quantifiable measure that’s tied directly to a key business objective (e.g. revenue growth, website traffic, customer retention). The metrics must reflect what matters to the organization and project success.
Participation
Secure stakeholder involvement early. Executive buy-in is essential for prioritizing implementation and ensuring follow-through. At the same time, frontline engagement from engineering managers and project stakeholders, the people who’ll interpret the metrics, explain variances, and make day-to-day decisions based on the data, is also critical for adoption.
Clear Expectations
Establish baselines and thresholds. Without a historical benchmark, it’s impossible to know if a KPI is trending in the right direction. Use past performance indicators to set realistic thresholds, then define what triggers further investigation or intervention. For example, if lead time for changes increases 20% over baseline, does it signal a scope issue or a capacity constraint?
Outcome Reviews
Metrics that aren’t revisited lose value. Weekly or biweekly reviews help teams stay on track, while quarterly reviews support broader strategic recalibration. Consistency in cadence builds a culture of accountability around project performance.
Finally, avoid the trap of “vanity metrics.” High story point velocity or commit volume may look impressive but often say little about customer impact or an organization’s success. Focus instead on metrics that prompt action—like incidents closed without root cause, time spent on rework, or percent of roadmap items delayed. Actionable KPIs serve as operational levers, not just scorecards. Including stakeholders in KPI design ensures metrics reflect real-world success criteria.
Below is an example of how leading engineering organizations link KPIs to specific thresholds and operational responses:
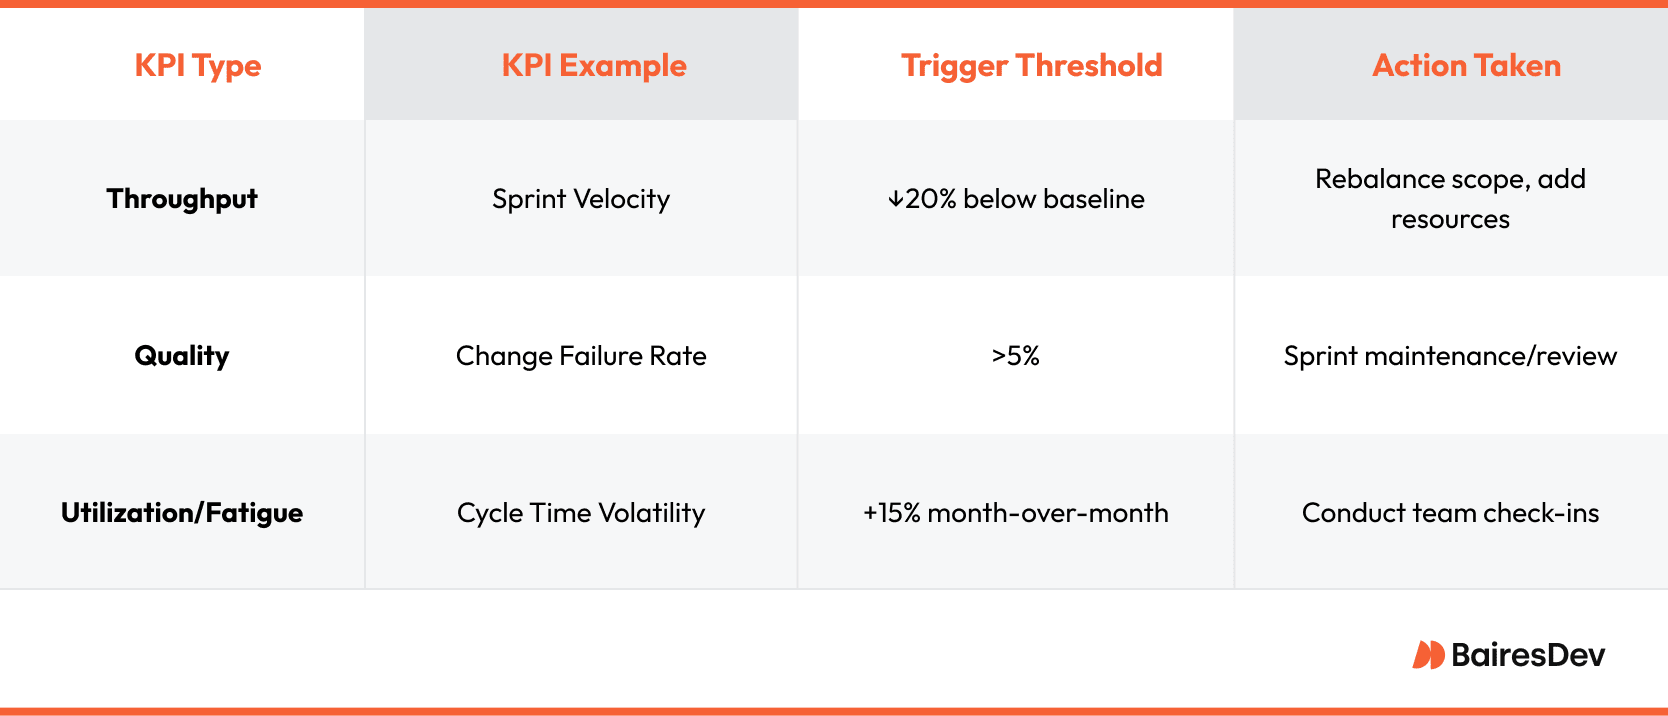
This kind of structure helps teams and leaders not only monitor progress and measure performance but know exactly when to dig deeper or shift resources—closing the gap between insight and execution.
Implementing a KPI system isn’t a one-off project. It’s an ongoing process of refining what you measure, how you review it, and how it drives decision-making. When done well, it becomes a force multiplier for visibility, alignment, and execution at scale.
Use Cases: What KPI Systems Unlock
A well-implemented KPI system should surface patterns that are hard to see in day-to-day operations. Here are some of the most valuable use cases for engineering and technology executives.
Executive-level visibility across departments
As organizations grow, delivery data gets fragmented across tools and teams. KPI systems consolidate this data, allowing VPs and CTOs to compare business performance across product lines, geographies, or business units.
With a single view of throughput, operational efficiency, and reliability, leaders can spot outliers, manage risk factors proactively, and communicate clearly with peers and the C-suite. A well-implemented KPI system provides a consolidated view of KPI data across teams and departments. For example, consider the following chart:
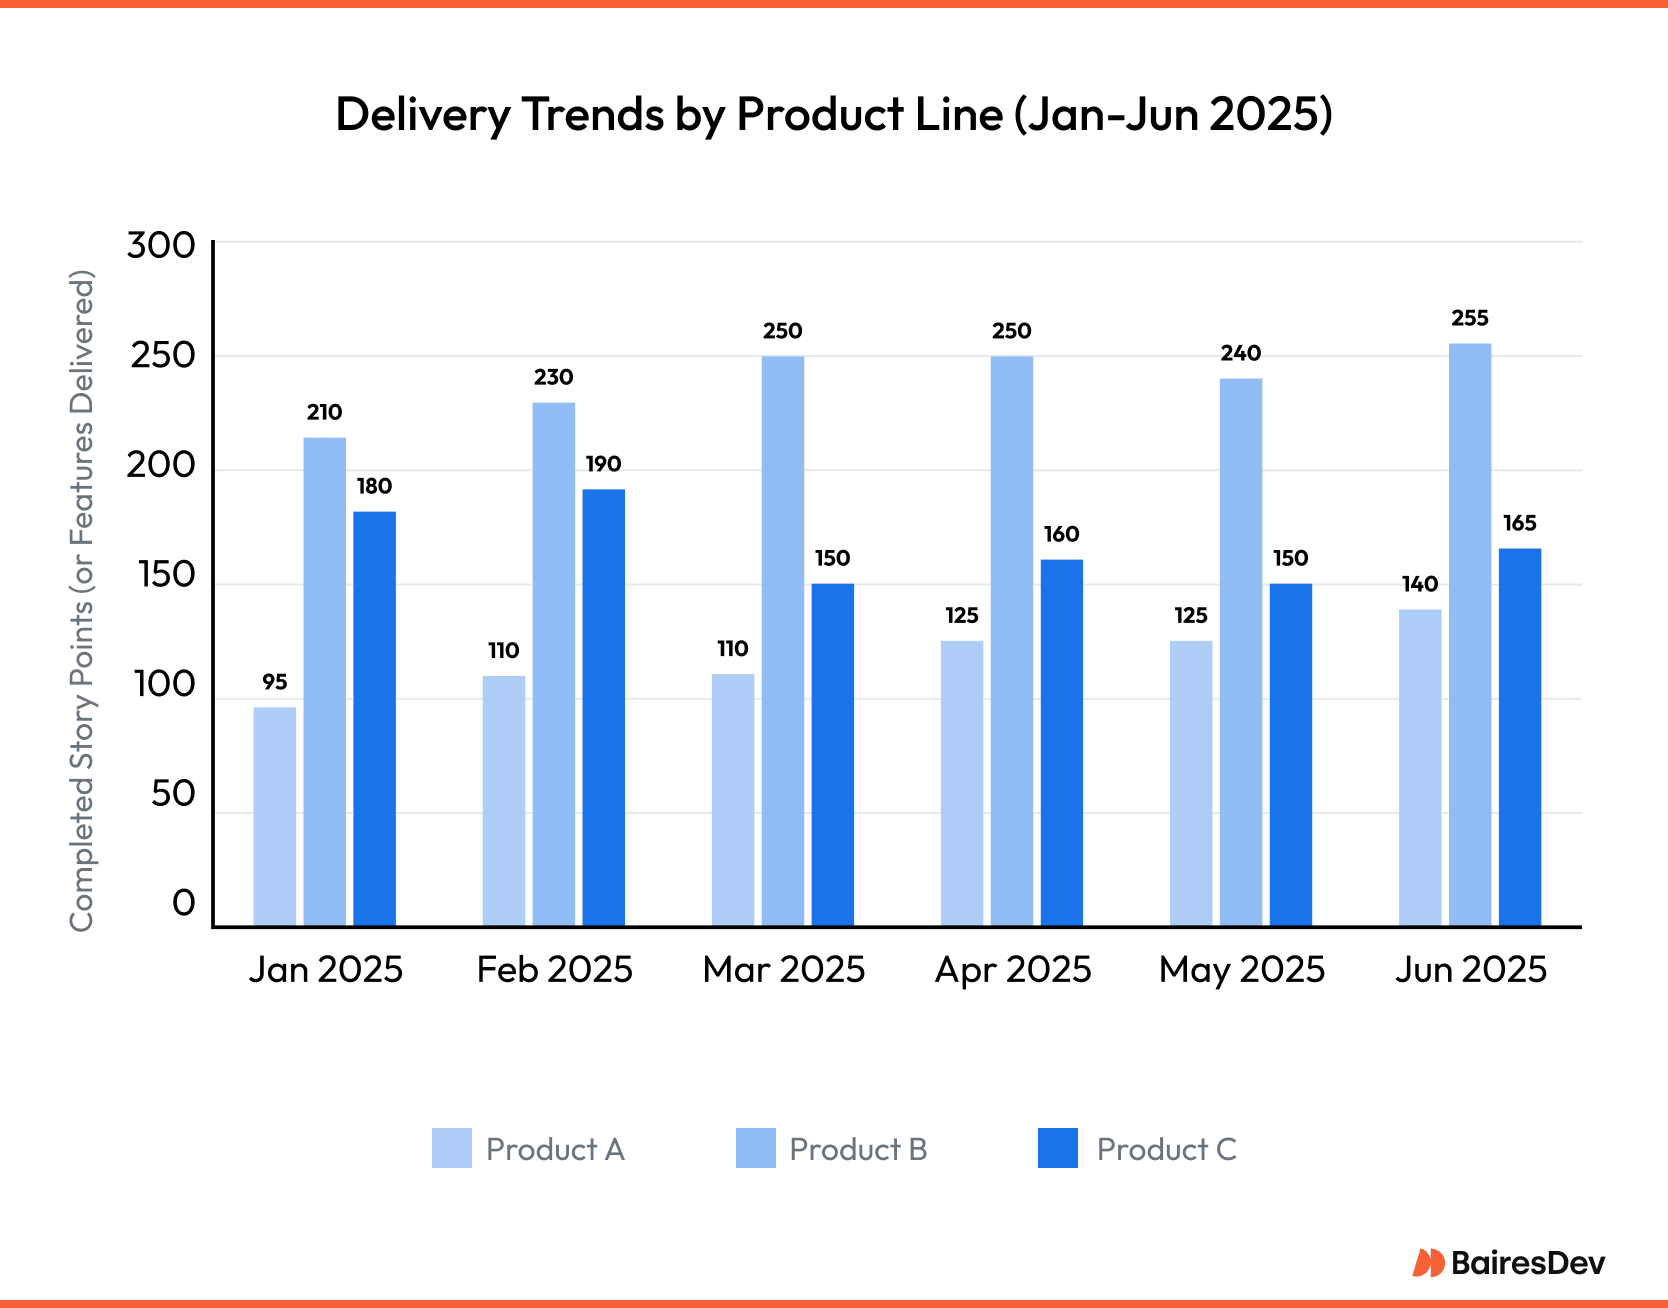
This chart illustrates how KPI systems can help leaders measure performance across product lines and identify areas for improvement. With a single view of trends, leaders can track performance, spot outliers, manage risk proactively, and communicate clearly with peers and the C-suite.
Improved forecasting and hiring plans
Historical delivery trends help organizations model future capacity needs more accurately. KPIs like sprint throughput, units produced, cycle time, and unplanned work ratios provide early signals that a team is nearing saturation, or has room to take on more.
This supports better headcount planning, budget alignment, and resource utilization, while keeping an eye on cost variance. That’s especially important in environments with fast growth and narrow hiring windows.
Identifying team fatigue or underutilization
Burnout and under-engagement can both drag down performance, but they often go unnoticed until they show up in missed deadlines or attrition. KPI systems surface subtle changes in delivery patterns—like velocity drop-offs, increasing rework, or a spike in after-hours activity—that might indicate a team is stretched too thin or not challenged enough.
This can impact employee satisfaction and retention. Early visibility gives leaders time to rebalance workloads or intervene supportively.
Measuring the ROI of roadmap initiatives
Without KPIs, it’s hard to know if a strategic investment is paying off. With the right metrics in place—deployment frequency, feature adoption rates, customer satisfaction, or support ticket volume—leaders can track whether new capabilities are delivering impact, increasing retention, or improving customer lifetime value, customer loyalty, and net promoter score—key metrics for measuring long-term product and revenue impact. This also helps justify engineering investments to non-technical stakeholders and guide future prioritization.
Aligning engineering with growth funnels. KPI platforms can help link delivery metrics with business outcomes like qualified leads, marketing qualified leads, or sales qualified leads—showing how new features affect acquisition, conversion, or upsell. When engineering efforts map cleanly to growth and revenue, it strengthens cross-functional collaboration and informs better product decisions.
Next Steps: What to Look for in a Partner
Choosing the right partner to implement or extend a KPI system goes beyond evaluating software features. It requires a focus on long-term fit—both technical and operational. For enterprise engineering leaders, the right partner should bring more than tools. They should bring experience, stability, and engineering maturity.
Look for proven experience with enterprise integrations. Off-the-shelf platforms often claim plug-and-play connectivity, but in reality, integration with systems like Jira, GitHub, Datadog, Salesforce, or internal tools can be complex. A strong partner should have a track record working across varied tech stacks, handling both the API-level work and the data modeling required to produce consistent, trustworthy KPIs.
Prioritize engineering maturity. Many vendors can build dashboards. Fewer understand the nuances of how engineering work flows through an enterprise system. A capable partner will help you define metrics that reflect real delivery performance—not just surface-level activity—and ensure the data behind them is clean, normalized, and tied to business strategy.
Ensure real-time support and long-term maintainability. KPI systems don’t stand still. As your org evolves—through new teams, tools, or strategic shifts—your metrics and infrastructure need to adapt. Look for a partner with a strong operational support model, solid security posture (SOC 2, SSO, RBAC, etc.), and a demonstrated ability to maintain and scale systems over time.
For most enterprises, implementing a KPI system isn’t just a technical project—it’s a change in how decisions get made. The right partner helps accelerate that shift while minimizing operational friction and risk. If they can speak fluently about strategic KPIs, business outcomes, and enterprise architecture, they’re likely a good fit.
Frequently Asked Questions
How do enterprise engineering leaders align KPIs with OKRs or roadmap delivery?
Start by cascading top-level strategic objectives (e.g., improve time-to-market by 20%) into measurable KPIs like lead time for changes or cycle time. Map these KPIs to team-level outputs, then regularly review them in conjunction with OKR progress. Use dashboards to measure progress and connect work (Jira tickets, PRs) to outcomes.
What are the tradeoffs between building a custom KPI dashboard vs. buying a SaaS tool?
SaaS tools are faster to deploy and often include ready-made integrations and templates, but can limit flexibility. Custom dashboards offer deeper integration and control (e.g., tying in internal tooling or custom metrics) but come with higher upfront cost, dev time, and long-term maintenance.
How can KPI systems support executive reporting and cross-functional decision-making?
Enterprise-grade KPI platforms allow leaders to create cross-department views (e.g., product, sales, engineering) that show trends and blockers across the org. They also enable top-down visibility into whether work aligns with company business goals, making it easier to shift priorities or reallocate teams.
What are the key security and compliance considerations when selecting KPI software?
Ensure the tool offers role-based access control (RBAC), audit logs, data encryption, and support for SSO/SCIM. For regulated industries, verify SOC 2 compliance or the ability to host in a VPC or on-prem. If metrics touch PII or customer data, ensure proper masking or redaction protocols are supported.
How do leading organizations integrate KPI dashboards with tools like Jira, GitHub, or Salesforce?
Through native APIs, webhook connectors, or middleware (e.g., Zapier, Segment). Most KPI platforms offer integrations, but large orgs often build custom ETL pipelines to normalize data across tools. Key is ensuring data freshness and schema consistency across sources.
What’s the best way to keep KPIs actionable and not just vanity metrics?
Tie each KPI to a decision-making path or operational lever. For example, don’t just track “story points completed” — track “lead time by team” and use it to adjust scope or hiring. If a metric doesn’t drive an action, question its relevance.
How can a KPI system improve forecasting and resource planning for engineering?
By analyzing historical velocity, work type breakdowns, and throughput trends, you can model delivery capacity more accurately. This supports better headcount planning, budget forecasting, and early detection of staffing bottlenecks.
What role do leading and lagging indicators play in identifying technical debt and team burnout?
Lagging indicators like rising defect rates or time spent on rework can signal tech debt. Leading indicators like decreasing commit frequency or sprint volatility might reflect burnout or disengagement. KPIs don’t replace 1:1s, but they highlight patterns worth investigating.


