

Your Kubernetes clusters are almost certainly overprovisioned.
According to the Cast AI 2025 Kubernetes Cost Benchmark, 99% of clusters carry more capacity than they use, with average CPU utilization around 10% and memory at 23%. That gap between what is allocated and what is consumed translates directly into cloud cost bloat: spend that nobody owns and nobody can explain.
If you have run a platform team for any length of time, this will sound familiar. Kubernetes cost optimization is an operating discipline that requires visibility, team-level accountability, and guardrails that let you rightsize and autoscale.
What follows is the framework we use for managing Kubernetes costs at scale, designed to help you balance cost with reliability. First, get visibility into your cluster spend. Then attribute it to the teams and services that drive it. Finally, execute waste reduction through rightsizing and autoscaling, with safety built in at every step.
QUICK METRICS
- 99% of Kubernetes clusters are overprovisioned (Cast AI 2025)
- 10% average CPU utilization across production clusters
- 30-45% of cluster spend is typically wasted on idle resources
- Up to 90% savings from spot instances for fault-tolerant workloads
Why Kubernetes Cost Is Hard to See on Your Cloud Bill
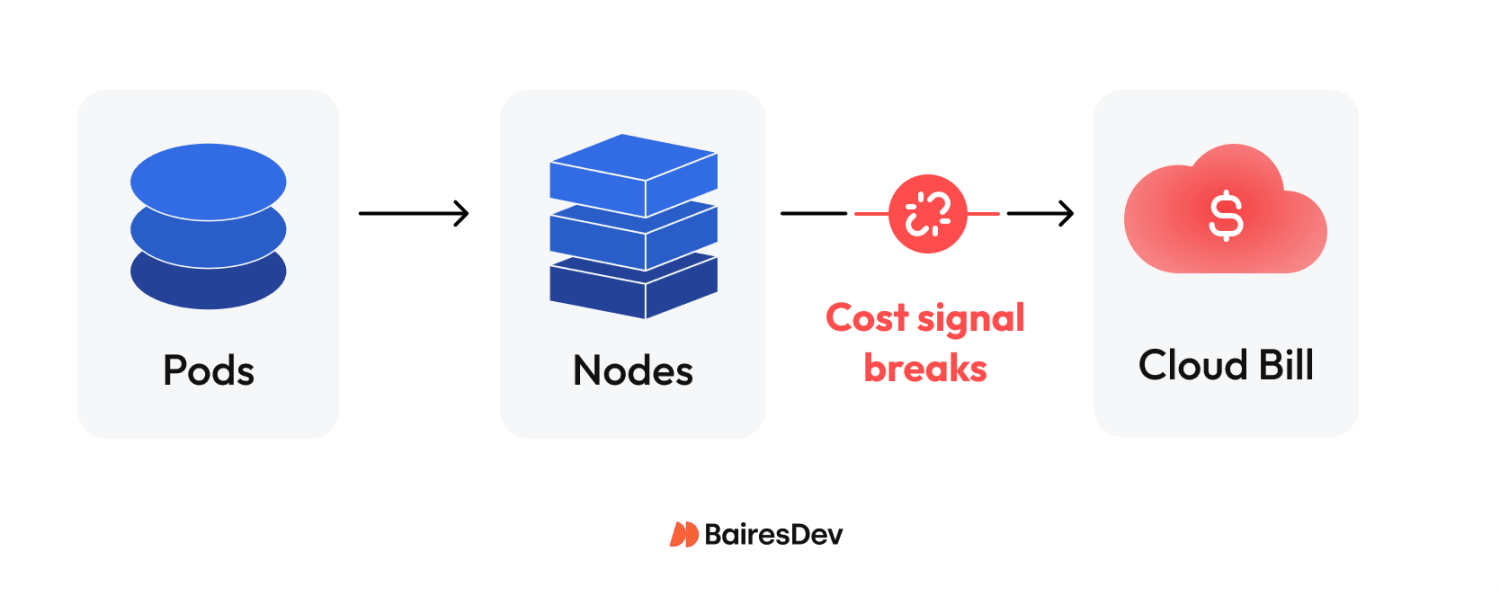
Kubernetes puts layers of abstraction between resource consumption and your cloud cost. Pods consume CPU and memory. Pods run on nodes. Nodes are cloud instances you pay for by the hour. Between scheduling overhead, shared infrastructure, and idle capacity, the link from a container’s real utilization to a line item on your invoice breaks down fast.
The challenge breaks into three parts. First, compute costs arrive as instance-level charges: your cloud bill shows EC2 or GCE costs, not “what the payments service consumed.” Even AWS Cost Explorer gives you no pod-level breakdowns by default. Second, clusters share resources across teams and namespaces, making attribution ambiguous. Third, most computing resources sit idle. The gap between what teams request and what workloads consume is where your money disappears.
Without visibility, spend governance is guesswork. And guesswork at scale is how your cloud spending grows 30% year-over-year while traffic grows 10%. That is how unnecessary costs compound, a risk you carry every quarter you delay.
Cost Visibility and Allocation
You cannot run a cost review with your CFO if nobody can explain where the money went. Effective spend governance starts with seeing what you spend and attributing it to who spends it. In practice, that means mapping resource utilization to organizational units: teams, services, products, and environments.
The OpenCost specification provides a standard model for cost allocation. OpenCost is a CNCF incubating project that allocates spend by namespace, label, deployment, and other Kubernetes-native constructs. For cost management across multiple Kubernetes clusters, Kubecost extends OpenCost with multi-cluster dashboards, discount handling, and historical data retention.
Both are open-source resource management tools with active community support that plug into your existing observability stack, are cost-effective relative to commercial alternatives, and reduce the manual effort of cost analysis across namespaces.
Build your allocation model around namespaces and labels. Namespaces give you a clean organizational boundary. Labels let you tag workloads by team, product, and environment, the dimensions your finance and FinOps partners need for showback, chargeback, and financial management reporting. The FinOps Foundation framework calls this the “Inform” phase: you cannot optimize what you cannot attribute.
At minimum, you need three things. A dashboard where teams can create custom reports by service and namespace, refreshed daily. A weekly report that flags anomalies and trend changes. And cost alerts that fire when spend crosses defined thresholds.
Without this baseline, waste reduction never takes root, and your spend keeps climbing without anyone noticing until the quarterly review.
The Biggest Waste Patterns
Before you tune autoscalers or commit to reservations, you have to pinpoint where money is leaking. A CNCF microsurvey on Kubernetes FinOps asked engineering leaders what drives rising cluster spend. The top answers: overprovisioning (70%), lack of ownership (45%), and unused resources plus technical debt (43%).
| Waste Pattern | Signal | Fix | Owner |
| Overprovisioned nodes | CPU/memory utilization below 20% | Rightsize instance types; enable cluster autoscaler | Platform/SRE |
| Idle workloads | Pods running with near-zero consumption | Shut down or schedule for low usage periods | Service owners |
| Cluster sprawl | Multiple clusters with low utilization | Consolidate; use namespaces for isolation | Platform |
| Storage drift | Orphaned PVs, old snapshots, excessive log retention | Optimize storage; reduce storage costs | Platform/SRE |
| Data transfer costs | High cross-AZ or egress on cloud bill | Topology-aware routing; review data transfer charges | Platform/FinOps |
Storage drift is often overlooked: teams retain infrequently accessed data on premium tiers while critical data lacks proper lifecycle policies. Both inflate your cloud bill quietly.
Resource wastage by workload type is stark. Jobs and CronJobs waste 60-80% of allocated cluster resources. StatefulSets waste 40-60%. Even well-tuned Deployments waste 30-50%. I have seen teams running 200-node clusters at 12% CPU utilization for months without anyone flagging it.
The pattern is always the same: teams over-request because the cost of requesting too little (OOM kills, throttling, pager alerts) is felt immediately. The associated costs of requesting too much are invisible until the invoice arrives. That asymmetry drives most cluster spending overruns, and only leadership-level visibility breaks the cycle.
Rightsizing and Autoscaling Safely
Resource requests and limits are the control plane for both scheduling and infrastructure spend.
When teams set requests too high, nodes fill up on paper while real utilization stays low, and you pay for idle resources that exist only as headroom. When requests are too low, pods get evicted or throttled. Getting this right is the single highest-leverage cost optimization you can make, and getting it wrong is how teams create outages in the name of saving money.
Kubernetes gives you three autoscaling tools. The Horizontal Pod Autoscaler (HPA) scales replica count based on CPU, memory, or custom metrics. The Vertical Pod Autoscaler (VPA) adjusts CPU and memory requests per pod based on observed load. The Cluster Autoscaler adds or removes nodes when pods cannot be placed or nodes sit idle.
The critical rule: do not run HPA and VPA on the same metric. If HPA scales on CPU while VPA adjusts CPU requests, they will fight each other. Configure HPA on application-level metrics such as request rate and queue depth, and let VPA handle resource requests tuning. Without that separation, autoscaling creates its own failures: replicas thrashing with every traffic fluctuation, VPA-triggered pod restarts causing latency regressions, and OOM kills when limits are set too aggressively.
Start with caution. Run VPA in recommendation mode (updateMode: “Off”) to see what workloads actually need without changing anything. VPA recommendations help you optimize resource usage by identifying the minimum resources each pod requires under real load. Apply findings to non-production environments first. Set SLO guardrails: if latency or error rate crosses a threshold, roll back. Measure before and after every change, using cost data to confirm real savings.
This is how you cut costs without creating incidents.
Node and Pricing Strategy Across Cloud Services
After stabilizing resource allocation through rightsizing, the focus shifts to node-level pricing, where the biggest savings live.
Classify your Kubernetes workloads by interruption tolerance. Stateless, batch, and CI/CD workloads can handle preemption. Latency-sensitive and stateful services cannot. For tolerant workloads, spot instances deliver significant savings, up to 90% versus on-demand pricing, across major cloud services. But spot capacity can be reclaimed on short notice (two minutes on AWS, give or take). Your clusters need proper handling: graceful shutdown hooks, pod disruption budgets, and automatic rescheduling.
For predictable baseline capacity, reserved instances and savings plans lock in lower prices over one-to-three-year terms. The key rule: do not commit to reservations until your utilization is stable. Locking in a commitment on overprovisioned clusters just locks in waste at a discount. Rightsize first, observe real consumption for 60-90 days, then commit.
For most organizations, the hybrid approach delivers the strongest cost and operational efficiency. Run baseline workloads on reserved capacity. Layer spot capacity for burst and fault-tolerant workloads. Use on-demand only as a bridge. This combination can lower costs by 40-60% compared to running everything on-demand. The resulting reduction in compute costs and cluster costs changes the business outcomes conversation with your CFO.
This pricing model applies whether you run Kubernetes in hybrid environments, multi-cloud environments, or a single provider.
Guardrails, Cost Tracking, and the Operating Model
Without guardrails, gains from any effort to optimize costs erode within months. Every service shipped without resource quotas or labels adds cost you cannot track, attribute, or control. Sustainable resource management requires policy enforcement and a recurring review loop to maintain operational efficiency.
Start with resource quotas and limit ranges at the namespace level. Quotas cap total CPU and memory per namespace, enforcing fair resource allocation and preventing any team from overconsuming cluster resources. Limit ranges set defaults and ceilings for individual containers. Pods that ship without explicit requests still get reasonable resource configurations and cannot claim unlimited capacity.
Labeling standards are non-negotiable for cost tracking. Every deployment needs labels for team, service, environment, and cost center. Admission policies enforce this at deploy time. If a workload ships without required labels, it does not land. This is what makes cost attribution reliable rather than aspirational.
The operating loop ties it together:
- Monthly: Review spend by team and service. Flag trends. Adjust quotas where needed.
- Weekly: Triage waste and anomalies from your dashboard. Feed optimization changes into the backlog.
- Continuously: Monitor utilization against requests. Track cloud cost trends and data costs, including data transfer and storage. Tune autoscaling policies.
Top 12 Kubernetes Cost Optimizations to Run Safely
| # | Optimization | Risk | Validation Metric |
| 1 | Deploy cost visibility tooling (OpenCost/Kubecost) | Low | Cost allocation coverage by team/service |
| 2 | Enforce namespace labeling standards | Low | % of deployments with required labels |
| 3 | Set quotas per namespace | Low | Quota utilization rate per team |
| 4 | Add limit ranges with sane defaults | Low | Containers running without explicit requests |
| 5 | Rightsize requests using VPA recommendations | Medium | CPU/memory actual usage vs. requests |
| 6 | Enable Cluster Autoscaler for node scaling | Medium | Node utilization rate; pending pod count |
| 7 | Configure HPA on application-level metrics | Medium | Replica count vs. traffic; latency P99 |
| 8 | Shut down idle workloads and unused resources | Low | Pods with near-zero resource consumption |
| 9 | Consolidate underused Kubernetes clusters | Medium | Per-cluster utilization; operational overhead |
| 10 | Adopt spot instances for fault-tolerant workloads | Medium | Interruption rate; job completion rate |
| 11 | Optimize storage: clean orphaned PVs and snapshots | Low | Storage costs trend; orphaned volume count |
| 12 | Commit to reserved instances after utilization stabilizes | Low | Reservation coverage vs. actual usage |
Start at the top. Items 1-4 are low-risk foundations you can ship in a sprint. Items 5-10 require measurement and SLO guardrails. Items 11-12 are ongoing cost management discipline.
Expert Perspective
Kubernetes cost work compounds when you treat it as an operating loop, not a quarterly fire drill. I’ve seen the difference up close: teams that get visibility in place, assign ownership, and put a few guardrails around resource usage are the ones whose spend tracks with growth instead of outpacing it. Whether you have 50 or 5 clusters, the goal isn’t to chase the lowest possible bill. It’s to make spend predictable, visible, explainable, and tied to decisions the team actually controls.
The inflection point is usually when cost stops being “a platform problem” and becomes something service teams can reason about. That’s also where the safety discipline matters. One time we tightened requests in production based on a week of clean averages, and a nightly batch peak we hadn’t measured turned it into OOM noise and latency spillover. It wasn’t dramatic, but it was enough to remind everyone that “optimization” is still a production change: baseline real peaks, roll out gradually, validate against reliability signals, and keep rollback easy.
Once you run it that way, the work gets calmer. Labels and allocation make costs discussable, quotas and sane defaults prevent new waste from slipping in, and rightsizing becomes part of normal maintenance. Pricing levers are the last mile. Use them after utilization is stable.
Over time, teams keep velocity, finance gets fewer surprises, and cost control stops being a special project someone has to remember to do.
STRATEGIC TAKEAWAYS
- Kubernetes cost optimization is a loop, not a project: visibility, accountability, execution, review.
- You cannot optimize what you cannot attribute. Cost visibility comes first.
- Rightsizing resource requests is the single highest-leverage move for reducing spend.
- Do not lock in savings plans or reservations until resource utilization is stable.
- Guardrails (quotas, limit ranges, labeling standards) prevent gains from eroding.
- The operating model drives cost efficiency more than any single tool.


