

Data drives decisions, but only when it’s clear, fast, and actionable. According to IDC research, organizations that effectively use data visualization tools are 28% more likely to find timely insights and make faster decisions.
Tableau is one of the leading tools in this space. With support for more than 100 data connectors and an intuitive interface, it allows teams to turn raw information into interactive dashboards without custom coding and data analysts. Over 86,000 companies, from startups to Fortune 500s, rely on Tableau to modernize reporting and improve decision-making speed.
Hiring an experienced Tableau developer can accelerate implementation by integrating your data ecosystem, building scalable dashboards, and ensuring governance standards are met. The result is faster decisions, improved execution, and more reliable analytics at scale.
Introduction to Data Visualization: What Is Tableau
Data visualization is the art of transforming raw data into graphical representations. It plays a crucial role in business intelligence and data analysis. Tools like Tableau offer a wide array of features to create interactive and dynamic visualizations.
Data visualization skills depend data management and analysis, as well as non-technical skills like communication and storytelling. Data visualization can be applied in various business functions and across virtually any industry.
By leveraging visual analytics, organizations can foster a data-driven culture where decisions are informed by data insights. Tableau, as a leading data visualization tool, connects to a multitude of data sources, including relational databases and big data platforms.
Tableau Data Visualization Tool
Founded in 2003, Tableau has grown into a leading analytics platform built around VizQL, a proprietary language that translates drag-and-drop actions into optimized queries. Instead of writing SQL queries to analyze data, users specify what they want to see, and Tableau generates the query and visualization automatically.
Tableau relies on tools like Tableau Prep Builder for combining, shaping, and cleaning relevant data. Developers extend this further by integrating Tableau with existing systems, migrating data sources, and building more advanced presentations for enterprise needs.
Top Use Cases: How Enterprises Use Tableau
Enterprises adopt Tableau to solve high-impact business challenges, not just to create charts. Common use cases include:
- Consolidating KPIs across divisions – Tableau integrates data analytics from multiple business units into unified dashboards, giving leadership a single source of truth for performance tracking. This reduces the need for manual consolidation and ensures consistency across the organization.
- Automating compliance reporting – By connecting directly to core systems, Tableau streamlines the preparation of regulatory and audit reports. Automated updates cut down on manual effort, reduce errors, and provide audit-ready transparency for compliance teams.
- Enabling near real-time dashboards for leadership – Executives gain access to up-to-date metrics on operations, finance, or customer activity. This supports faster, better-informed decision-making without waiting for weekly or monthly reporting cycles.
- Scaling analytics without adding headcount – With self-service capabilities, business users can answer routine data questions independently, reducing dependency on data scientists and other data professionals. This allows teams to expand insight generation without proportionally increasing overhead.
Tableau’s self-service analytics enable users to explore and answer questions about data and create visualizations independently.
Tableau Services
Tableau’s platform offers 5 core services with dozens of add-ons and tools:
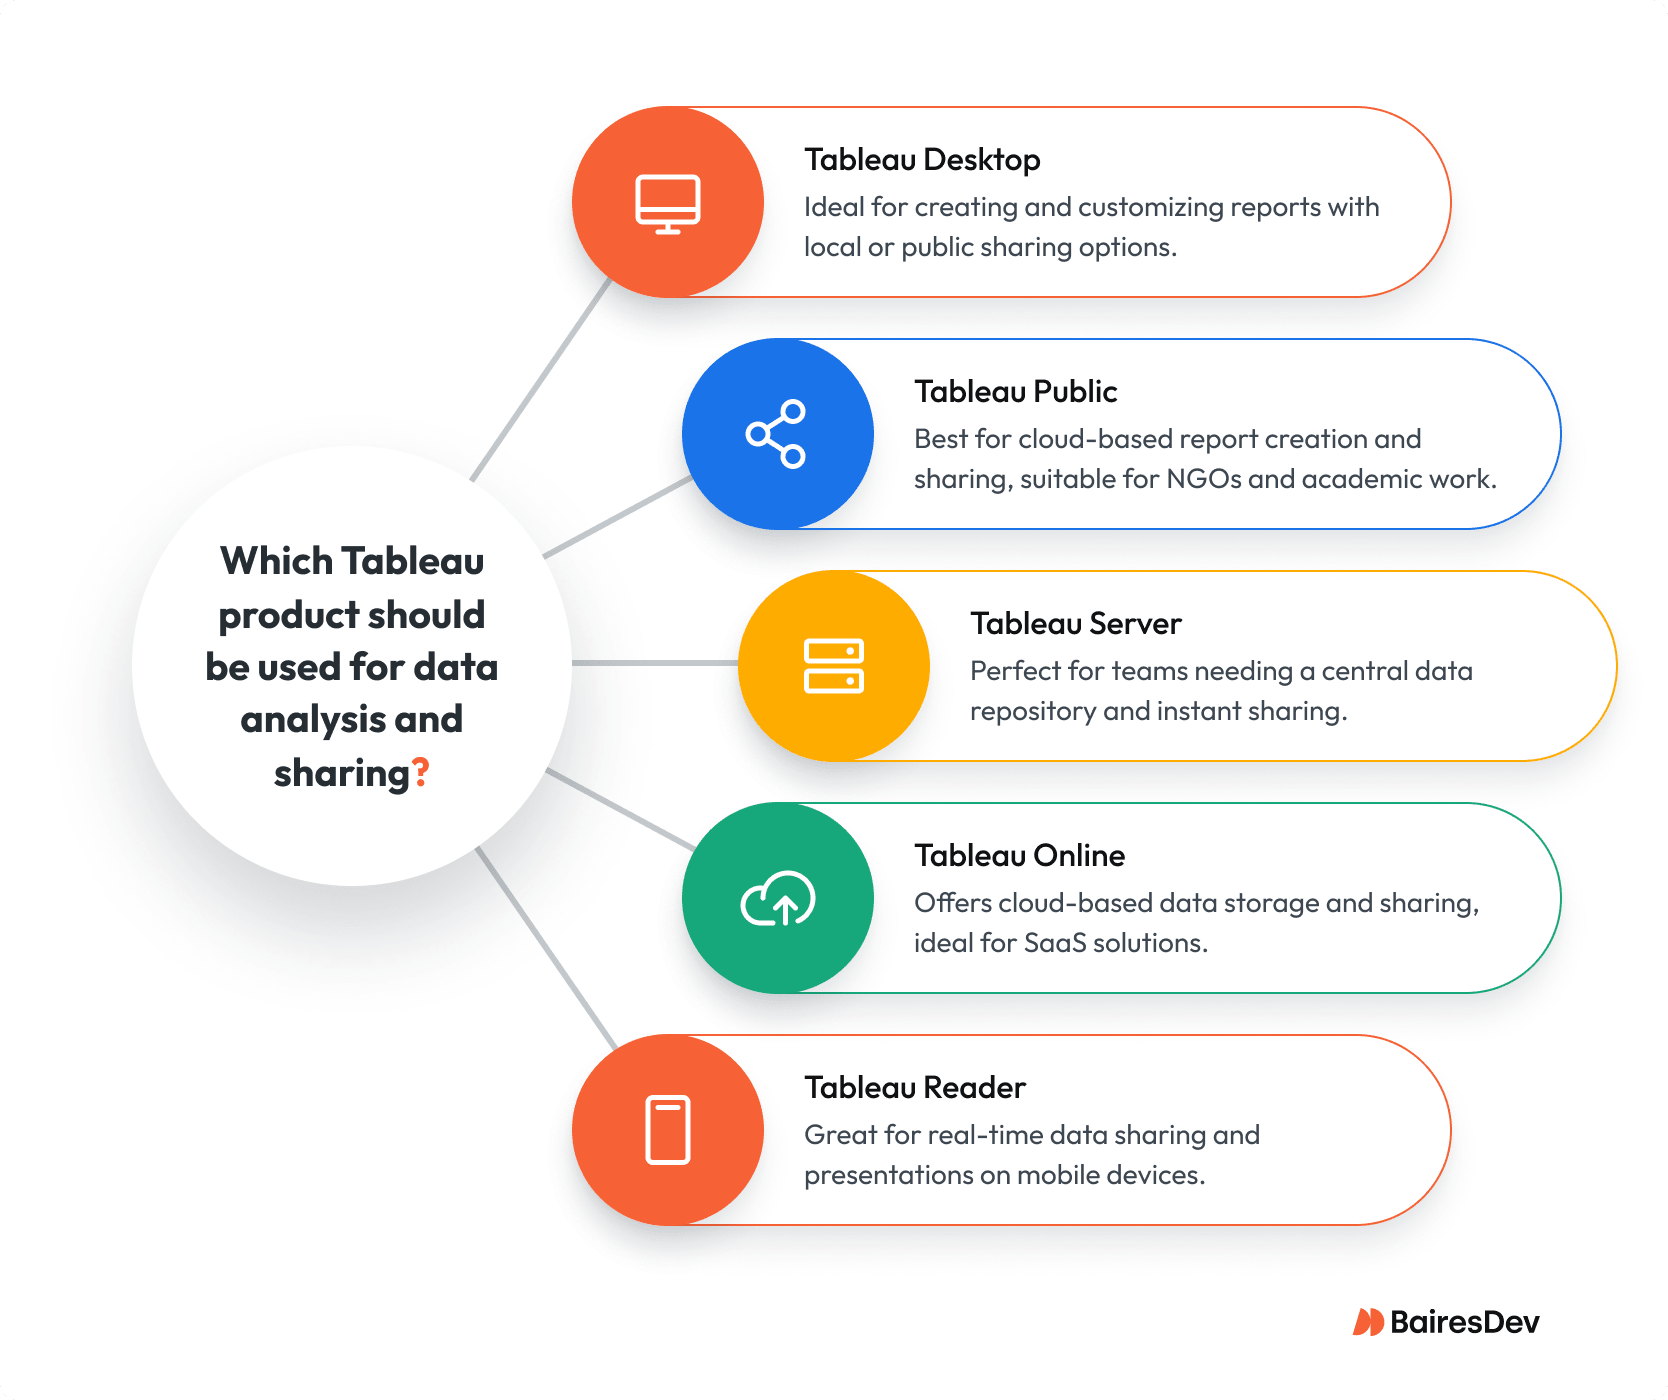
- Tableau Desktop – This is where Tableau users create and customize reports, blend them to form an all-encompassing Tableau dashboard, connect to data warehouses, load files, and create and share workbooks with coworkers. With the help of a Tableau developer, you can code and further customize your tools to fit your business needs. A Tableau dashboard provides a comprehensive view of data through various visual elements, enhancing data storytelling and user engagement.
- Tableau Public – Uses the cloud to share reports. Anyone with the link can access and share data, which is perfect for large organizations and collaborative projects.
- Tableau Server – Install a central repository for your data accessible to any authorized user, store your data, your visualizations, your user information, and share your business insights with your network instantly. The perfect solution for teams who work on the same data at the same time.
- Tableau Online – Similar to Tableau Server, with Online, you can share all your information with everyone on your network, with the difference that your data is safely stored in Tableau’s cloud. Tableau Online is intended for those seeking a software-as-a-service solution.
- Tableau Reader – Reader is used to share data and insights in real-time with coworkers. It’s a free, lightweight app available on all mobile devices, ideal for presentations and meetings.
Connecting Tableau to Data Sources Made Simple
Connecting to data sources is a critical step in the data visualization process. In practice, Tableau simplifies this by offering a wide range of data connectors that link to traditional relational databases, cloud storage, and even large datasets.
Users can connect through tools like SQL Server, Google Analytics, and Microsoft Excel. Once connected, Tableau’s data management features—such as data blending and integration with data warehouses—help users organize and prepare their data for analysis.
Tableau also supports non-relational databases like NoSQL and Hadoop, making it suitable for handling large and complex datasets. By connecting to diverse data sources, users can centralize their data and use it to drive better decisions and business outcomes.
Why Enterprises Choose Tableau?
Tableau stands out as a top choice for modern business intelligence. It works with nearly any type of data—qualitative or quantitative—and connects easily to sources like cloud platforms, databases, and online data feeds. Whether you’re pulling from a local Excel file or the cloud, Tableau makes it simple with drag-and-drop functionality and a wide range of visual options, from basic pie charts and tree maps, to motion charts.
But Tableau isn’t just about powerful tools. It’s backed by a global community of users who actively share insights, solve problems, and support each other. Tableau has one of the most active and supportive user communities in the BI tool space. Whether you’re troubleshooting a dashboard or looking for inspiration, you’ll find help in forums, blogs, and social media groups where users share tips, answer questions, and swap ideas.
Building a strong data culture can be a challenge. Many teams struggle with juggling multiple analytics tools, integrating and managing data in daily workflows, all while keeping costs in check. That’s where a Tableau expert can make a difference—helping you tailor the platform to your company’s goals and resource constraints, and streamline processes.
Tableau Security and Governance
Tableau offers strong security and governance features to ensure data is stored and accessed safely. It includes built-in authentication and authorization tools that let administrators manage user access and control data usage.
Sensitive data is protected through encryption and masking. Tableau also meets key compliance standards, including SOC II and ISO, reinforcing its reliability for secure data handling.
Tableau provides scalable governance tools like auditing and activity logging, helping teams track data access and user behavior. It also supports data privacy regulations, making it easier to stay compliant.
By using Tableau’s security and governance capabilities, businesses can protect sensitive information, meet regulatory requirements, and maintain control over their data environment.
When to Outsource Tableau Development
Implementing Tableau
You want to give Tableau a try but are not sure where to start? Our top-tier Tableau experts can guide you further to reduce any implementation risk.
Many organizations struggle to fully operationalize Tableau due to limited internal bandwidth or lack of specialized expertise. Outsourcing Tableau development offers several advantages:
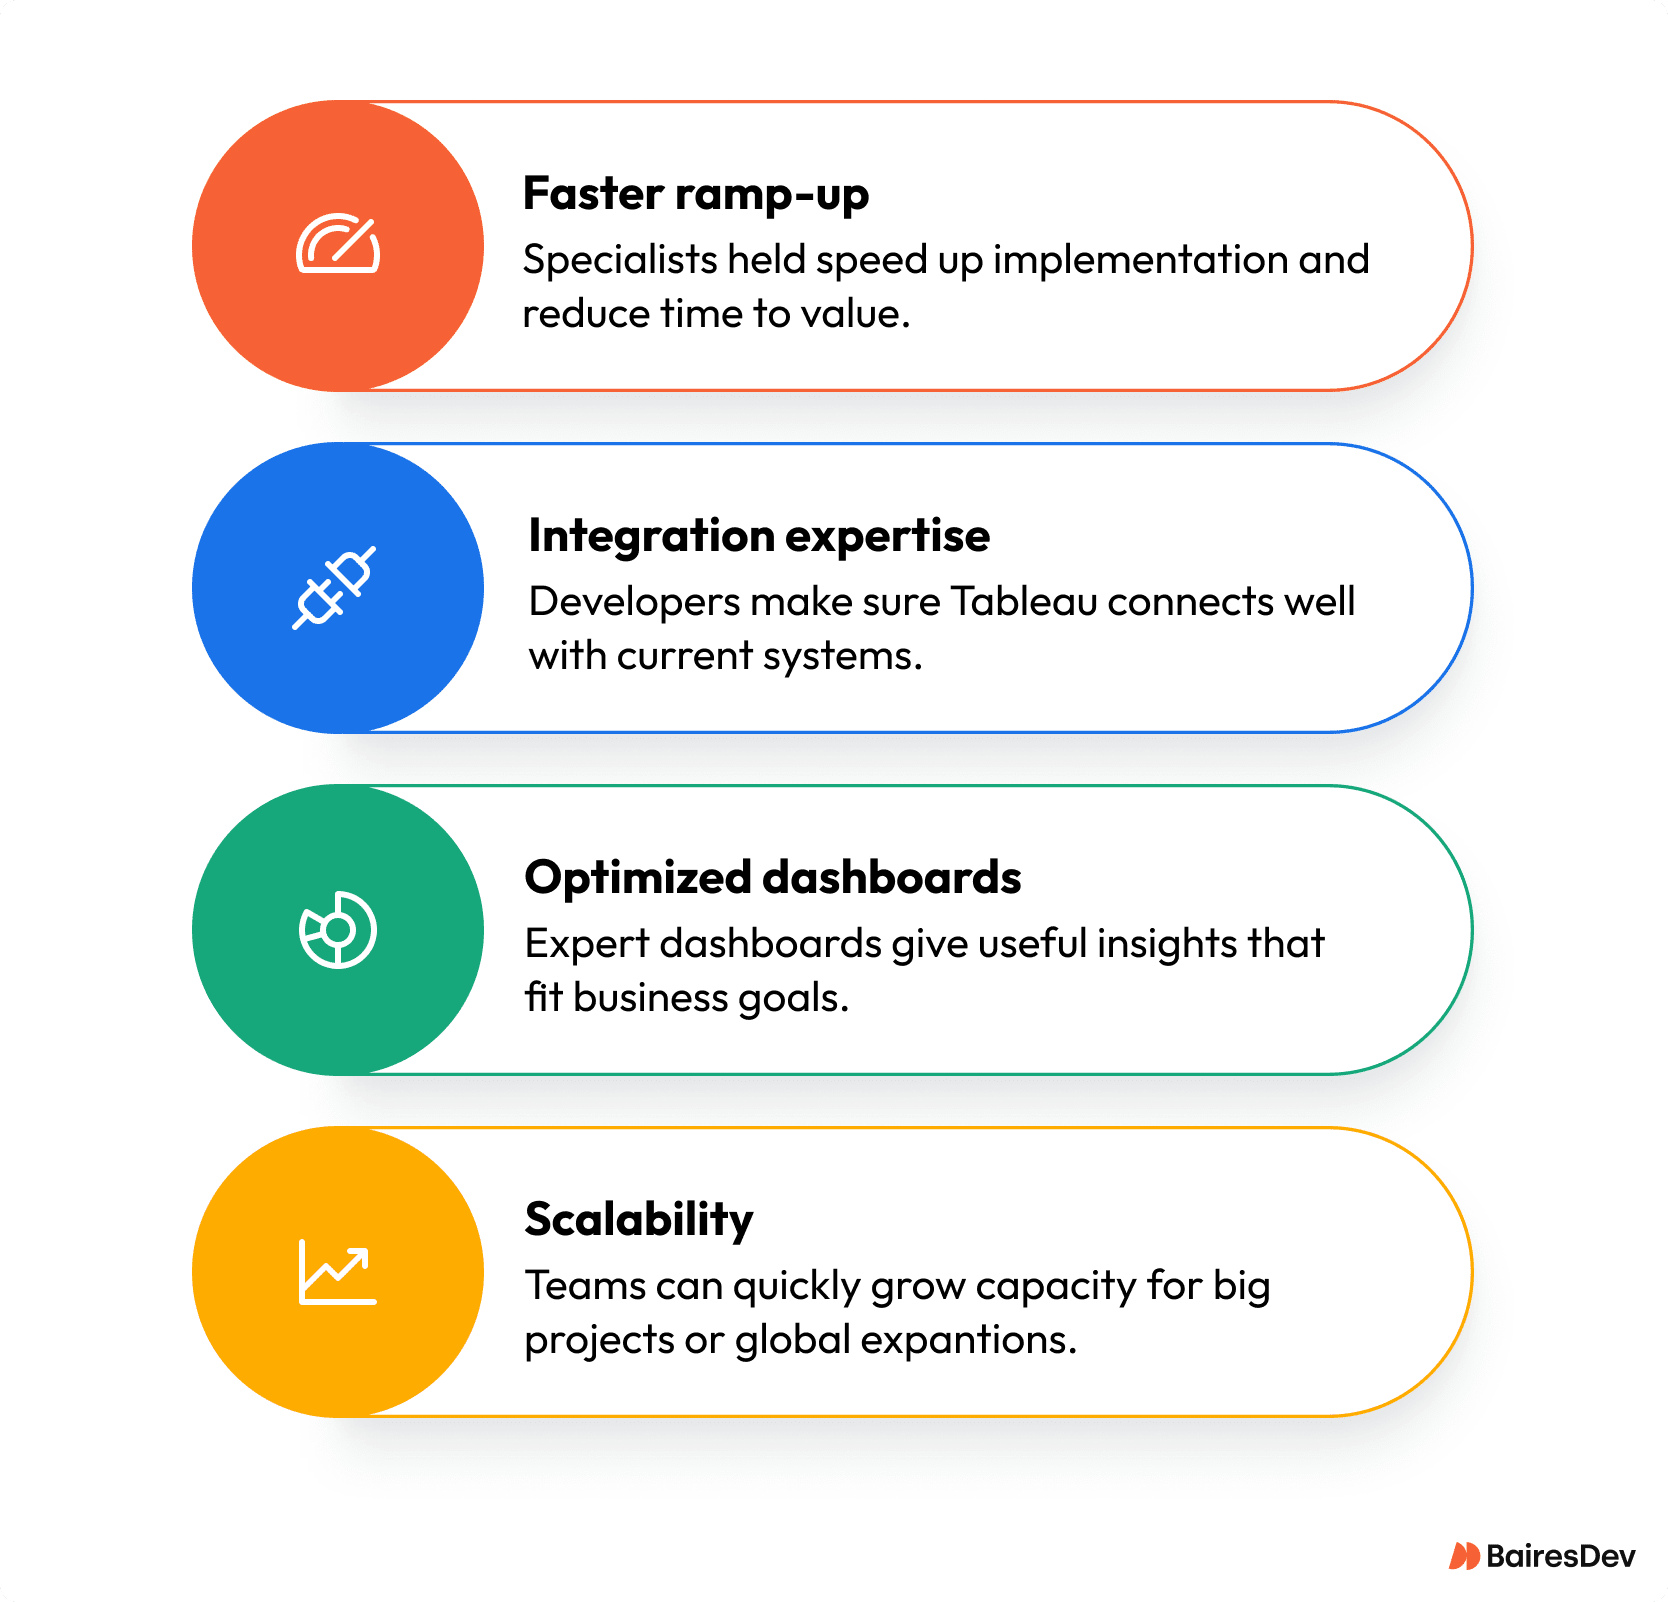
- Faster ramp-up – Specialists accelerate implementation and reduce time-to-value.
- Integration expertise – Developers ensure Tableau connects seamlessly with existing systems and workflows.
- Optimized dashboards – Expert-built dashboards deliver actionable insights tailored to business priorities.
- Scalability – Outsourced teams can expand capacity quickly for large initiatives or global rollouts.
For organizations looking to modernize data practices, outsourcing Tableau development is often the fastest path to impact.
Frequently Asked Questions
How long does a typical Tableau implementation take?
For a mid-sized enterprise, initial deployment and dashboard setup can take 4–8 weeks with the right expertise. Larger, multi-system integrations may extend to several months.
What are the risks of managing Tableau in-house?
Without experienced Tableau developers, teams often face delays in integration, poorly designed dashboards, and governance gaps that increase compliance risks.
How does Tableau compare to Power BI or Looker?
Tableau excels in visualization flexibility and enterprise scalability. Power BI is often chosen for organizations deeply embedded in Microsoft ecosystems, while Looker is strong for embedded analytics.
Can Tableau support global, high-volume data environments?
Yes. With Tableau Server or Online, organizations can scale to thousands of users and connect to large databases, provided infrastructure and governance are designed correctly.


