

If your first reaction to slow queries is to provision a bigger box, you’re not solving the problem, you’re just spending money. It’s the easiest answer, and it almost never addresses the root cause.
You don’t need to re-architect your entire stack or migrate to some buzzword-compliant “data lake” just because response times are creeping up. Before you sign another six-figure cloud hardware PO, you need to master the high-impact levers already at your disposal.
This isn’t theory. This is about the handful of practical PostgreSQL performance tuning techniques that solve 80% of performance issues. We’re going to cover what actually matters: indexing strategy, common query anti-patterns your team is probably writing right now, and the few memory settings that can make or break your database.
Query Optimization Techniques
According to Andrew Atkinson, author of ‘High Performance PostgreSQL for Rails’, many performance issues stem from good database schema design practices like indexing.
Without proper observability and Postgres query optimization, these issues can gradually become problematic, resulting in revenue loss, customer churn, and long maintenance windows which can breach uptime guarantees.
PostgreSQL Indexing Issues
Indexing is one of the most impactful query optimization strategies. Issues like over-indexing or under-indexing can cause slow queries in PostgreSQL.
Unused indexes degrade write operational performance, and in heavily updated tables, can exceed the size of the table itself. They also slow down backups, restores, and `VACUUM` processes due to index bloat.
Underindexing also causes slow performance:
- The query planner has to frequently scan entire tables. Sequential scans can be really slow, especially for a table with millions or billions of rows.
- Operations can take hours, impacting data refresh. As a result, outdated information is the only one available for making business decisions.
- Some tables may require more indexes based on how the table and row data are accessed.
From a business perspective, indexing issues lead to increased infrastructure costs and may even force migration to a different tech stack.
Longer RTO during outages can impact SLAs, and affect product development, as new indexes needed for features can’t be deployed quickly.
The Indexing Playbook: How to Fix the Mess
So how do you fix years of index neglect without taking the whole system down for a week? You get methodical.
Both short and long-term strategies and maintenance tasks are required to solve indexing problems.
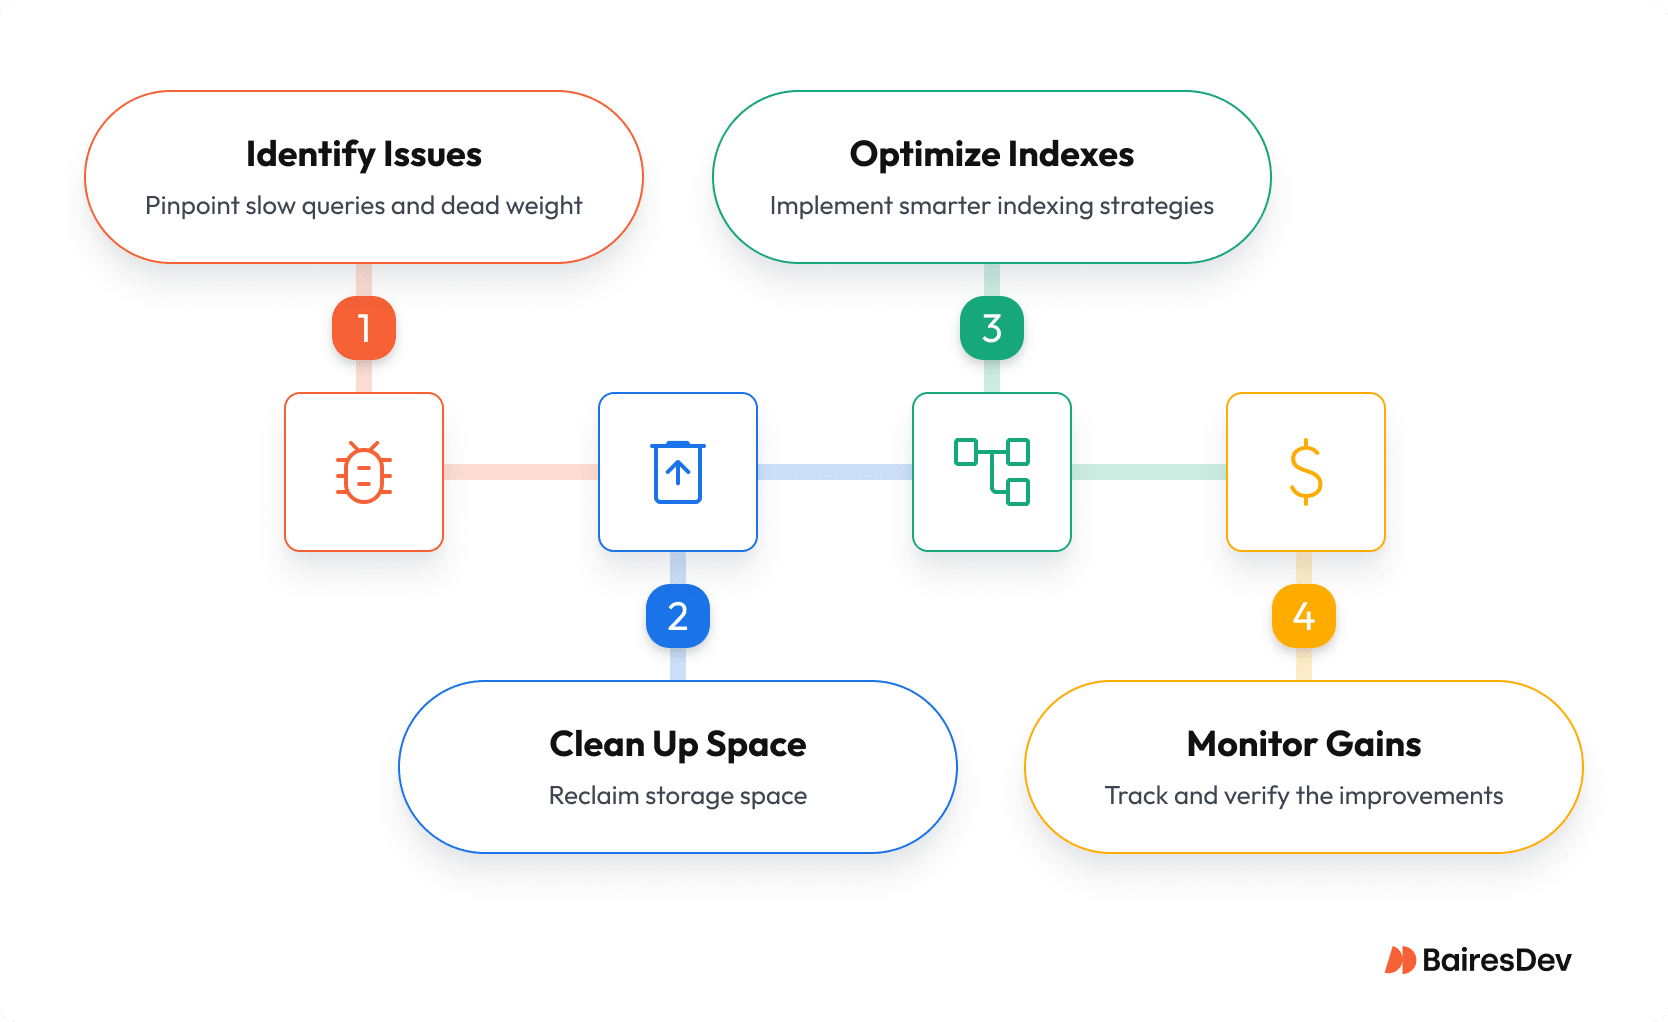
Some steps to take include:
Step 1: Find the Dead Weight & Slow Queries
Don’t guess. Use data to find your targets.
- Understand Usage: Start with `pg_stat_all_indexes` and `pg_statio_user_indexes` to see access counts and I/O patterns. Look for any index where the `idx_scan` count is zero or extremely low over a representative time window (remember, these stats reset on restart).
- Analyze Queries: Your ground truth is `EXPLAIN`. For a deeper look when it’s safe, use `EXPLAIN (ANALYZE, BUFFERS)` to see execution details and cache usage. If the raw text is too dense, visualizers like pgMustard or Dalibo make the plans obvious.
Step 2: Clean Up and Reclaim Space
Once you have your targets, act with precision.
- Drop Unused Indexes: For indexes you’ve confirmed are unused, drop them with `DROP INDEX CONCURRENTLY`. This avoids a long, blocking lock, minimizing the impact on your running application.
- Fix Bloat: For bloated tables and indexes, first measure the problem with pgstattuple or a script. Then, to rebuild an index online, use `REINDEX CONCURRENTLY`. To rebuild an entire table online, you’ll need the community-standard tool, `pg_repack`.
- A Critical Note on VACUUM: Routine `VACUUM` (and `AUTOVACUUM`) is essential for marking dead rows as reusable, but it does not reclaim disk space or drop unused indexes. `VACUUM FULL` does reclaim space, but it takes an `ACCESS EXCLUSIVE` lock on your table, blocking all activity. Use it only if you can afford complete downtime for that table.
Step 3: Index Smarter, Not Harder
Stop just indexing every foreign key. Create indexes that are purpose-built for your most important queries. Remove duplicate or redundant indexes. If you have an index on (col_a) and another on (col_a, col_b), the second one often makes the first one unnecessary.
Create with Purpose. Prioritize creating indexes that match your application’s access patterns:
- Composite Indexes: Match the columns in your WHERE clauses and ORDER BY clauses. An index on (`status, created_at`) is perfect for finding all active items in chronological order.
- Partial Indexes: Use these for low-cardinality flags. If you’re always querying for `WHERE is_active = true`, create an index only on that small subset of rows.
- Covering Indexes: The goal here is an index-only scan. Use the `INCLUDE` clause to add columns that aren’t used for filtering but are needed in the `SELECT` list. This lets Postgres get everything it needs from the index without ever touching the table heap, a huge performance win.
After adding or changing indexes, update statistics. Run `ANALYZE` on the table to ensure the query planner has up-to-date statistics to make smart choices.
Step 4: Verify Gains and Monitor Relentlessly
This isn’t a one-time project; it’s operational discipline.
- Verify: Confirm your improvements by re-running `EXPLAIN (ANALYZE, BUFFERS)` on the queries you targeted.
- Monitor: Enable the `auto_explain` module in a staging environment (or carefully in production) to automatically log the plans of slow queries. Use tools like the open-source `pghero` or commercial `pganalyze` to track index health and get alerts before problems get out of hand.
This isn’t just database gardening. A disciplined approach to indexing directly translates to smaller backups, faster restores (meeting your RTO), and a more stable database. It’s what keeps your write performance from degrading over time and ensures your development teams aren’t blocked.
Setting the Standard for Database Queries
The biggest performance problem isn’t always the database configuration. It’s often the well-intentioned developer who just learned a new SQL pattern and now uses it for everything. Teams need to enforce simplicity, correctness, and a set of sane standards.
Here are the principles your team should be following.
Enforce a Strict JOIN Policy
Your team needs a non-negotiable standard for how they write joins, because subtle errors here can lead to incorrect data and broken reports.
The most common red flag to watch for in code reviews is the misuse of a `WHERE` clause in a `LEFT JOIN`. When used incorrectly, it silently breaks the logic and turns the query into a simple `INNER JOIN`. This isn’t a style issue; it’s a correctness issue, and it’s a sign that the developer may not fully understand the data they are trying to retrieve.
Cultivate a “Correctness First, Optimize Second” Culture
Teams can waste days “optimizing” queries by changing join types based on a blog post, when the real problem was a missing index.
The policy must be: write the simplest, most logically correct query first.
The code should reflect the business question being asked. You should only greenlight optimization work when an `EXPLAIN` plan proves there’s a real, measurable performance problem. This prevents engineers from chasing ghosts and focuses their efforts on bottlenecks that actually impact the system.
Make Indexing Part of the Design Review
This is a basic architectural checkpoint. When your team proposes a new feature that requires joining large tables, the first question in the design review should always be: “Are the join keys indexed on both sides?”
If the answer is “no” or “we don’t know,” the design isn’t ready. Making this a mandatory check will prevent entire classes of future performance disasters before a single line of code is written.
Setting the Standard: Subqueries and CTEs
Standards for subqueries should be strict, as they are a common source of hidden performance traps.
- Correlated Subqueries in the SELECT list are a major red flag. They execute once for every single row in the outer query, which can turn a simple-looking query into a system-killer under load. This pattern should be explicitly discouraged in favor of a standard JOIN.
- The team should standardize on NOT EXISTS over NOT IN. The NOT IN operator can produce unexpected results with NULL values and, more importantly, the PostgreSQL optimizer often can’t transform it as effectively as it can an EXISTS check. It’s a simple change that improves both correctness and performance.
For Common Table Expressions (WITH clauses), the guiding principle is clarity, not complexity. They are excellent for breaking a complex query into logical, readable steps. However, when you see queries with multiple, “daisy-chained” CTEs, it’s a sign that the underlying logic is too convoluted.
These queries can be hard for the planner to optimize and even harder for another developer to debug. Your standard should be to encourage CTEs for readability but flag any query with more than a few chained WITH clauses for a mandatory review.
System-level performance tuning
PostgreSQL includes various system-level tunable configuration parameters that can significantly increase database performance at scale.
The Three Key Memory Settings
Memory tuning is a balancing act. Get it wrong and you invite instability, get it right and you avoid oversizing. Most teams do not need every knob. For most workloads, it comes down to three configuration settings and one architectural standard.
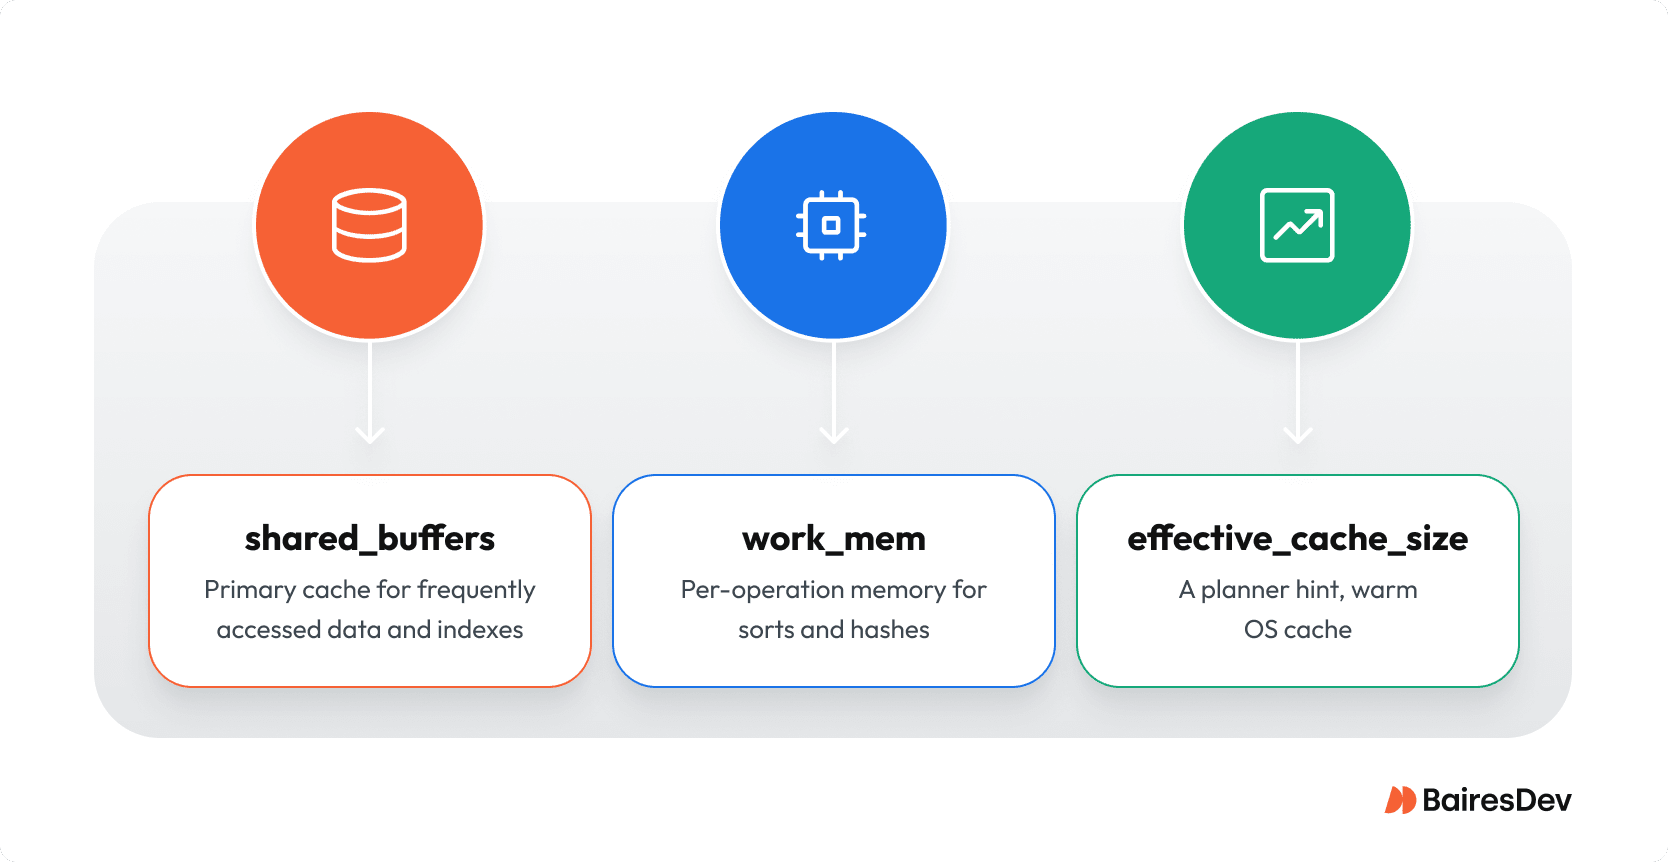
shared_buffers
- What it is: PostgreSQL’s primary cache for frequently accessed data and indexes.
- Principle: Size it to hold the hot working set. This one setting is the largest single factor in the database’s overall memory usage. The classic starting point for a dedicated database server is 25% of your system’s RAM. Read-heavy systems can push toward 40%, with headroom left for the operating system cache.
- Signal: Sustained high cache hit rate and low read I/O at peak.
work_mem
- What it is: Per-operation memory for sorts and hashes.
- Principle: Costs multiply per operation and per connection. Keep the global value conservative and raise it only for known heavy jobs at the session level.
- Signal: Rising temporary file activity indicates spills to disk; target increases to the specific job rather than a global change.
effective_cache_size
- What it is: A planner hint, not an allocation.
- Principle: On dedicated hosts, set roughly 70–80% of RAM so the planner can assume a warm OS cache. Adjust if other services share the box or on managed platforms.
Connection Pooling as Standard
This is the single most important architectural decision for a scalable production database.
A native PostgreSQL connection is a heavyweight process that consumes significant memory. Trying to handle thousands of clients by increasing `max_connections` is a recipe for memory exhaustion and instability.
The Solution? You must use an external connection pooler like `pgBouncer`. A pooler maintains a small, stable number of active connections to the database and funnels thousands of lightweight client connections through them.
The policy is clear: do not increase max_connections to handle application scale. That is the wrong tool for the job. The correct architectural solution is a connection pooler.
Advanced Tuning: From Recipes to Results
Once the fundamentals are solid on your PostgreSQL instance, you can address the system’s core behavior. Insights from monitoring PostgreSQL will tell you when it’s time to pull these bigger levers. Tune parallelism, WAL cadence, and data layout to match CPU, storage, and recovery targets. The goal is to align the database’s behavior with your specific objectives.
Parallelism: A Tool, Not a Panacea
The guiding principle for parallel query execution is to be conservative. The settings should start near your server’s core count and are raised only when your team can prove a clear performance win on a specific, high-value workload (like a critical analytics job) through rigorous load testing. You’re always balancing faster reports against the risk of CPU starvation for your main transactional workload.
The WAL: Your Recovery Budget
Your Write-Ahead Logging (WAL) configuration is not just a performance setting; it’s tied directly to your recovery budget. Increasing max_wal_size will smooth out I/O for write-heavy applications, but the question for your team must be: “What does this do to our RTO?” A larger WAL can mean a longer recovery process. The final setting is determined by the downtime your operations can tolerate, not by a generic best practice. It’s a direct trade-off between performance and availability.
Data Layout: Keep Hot Paths Hot
Your cache is one of your most valuable assets. The primary goal of your data layout strategy should be to ensure that cold, infrequently used data is isolated, so your cache is always filled with the hot data that powers your application.
This can be done through architectural choices, like routing analytical queries to read replicas. For massive, ever-growing tables, the ultimate tool is partitioning. By breaking a huge table into smaller pieces (e.g., by month), you ensure that daily operations only touch the small, “hot” partition, keeping performance fast and predictable.
The Focus
When optimizing PostgreSQL performance, ask the right questions about the trade-offs. The result of a well-tuned system isn’t a list of perfect settings; it’s stable p95/p99 latency and predictable, documented recovery times.
Keep PostgreSQL Performance Tuning Simple
Stop looking for a single magic configuration setting that will solve all your problems. It doesn’t exist. Tuning PostgreSQL performance is a discipline, and it has a clear order of operations. Don’t waste your time tweaking advanced parameters if your queries are performing full table scans.
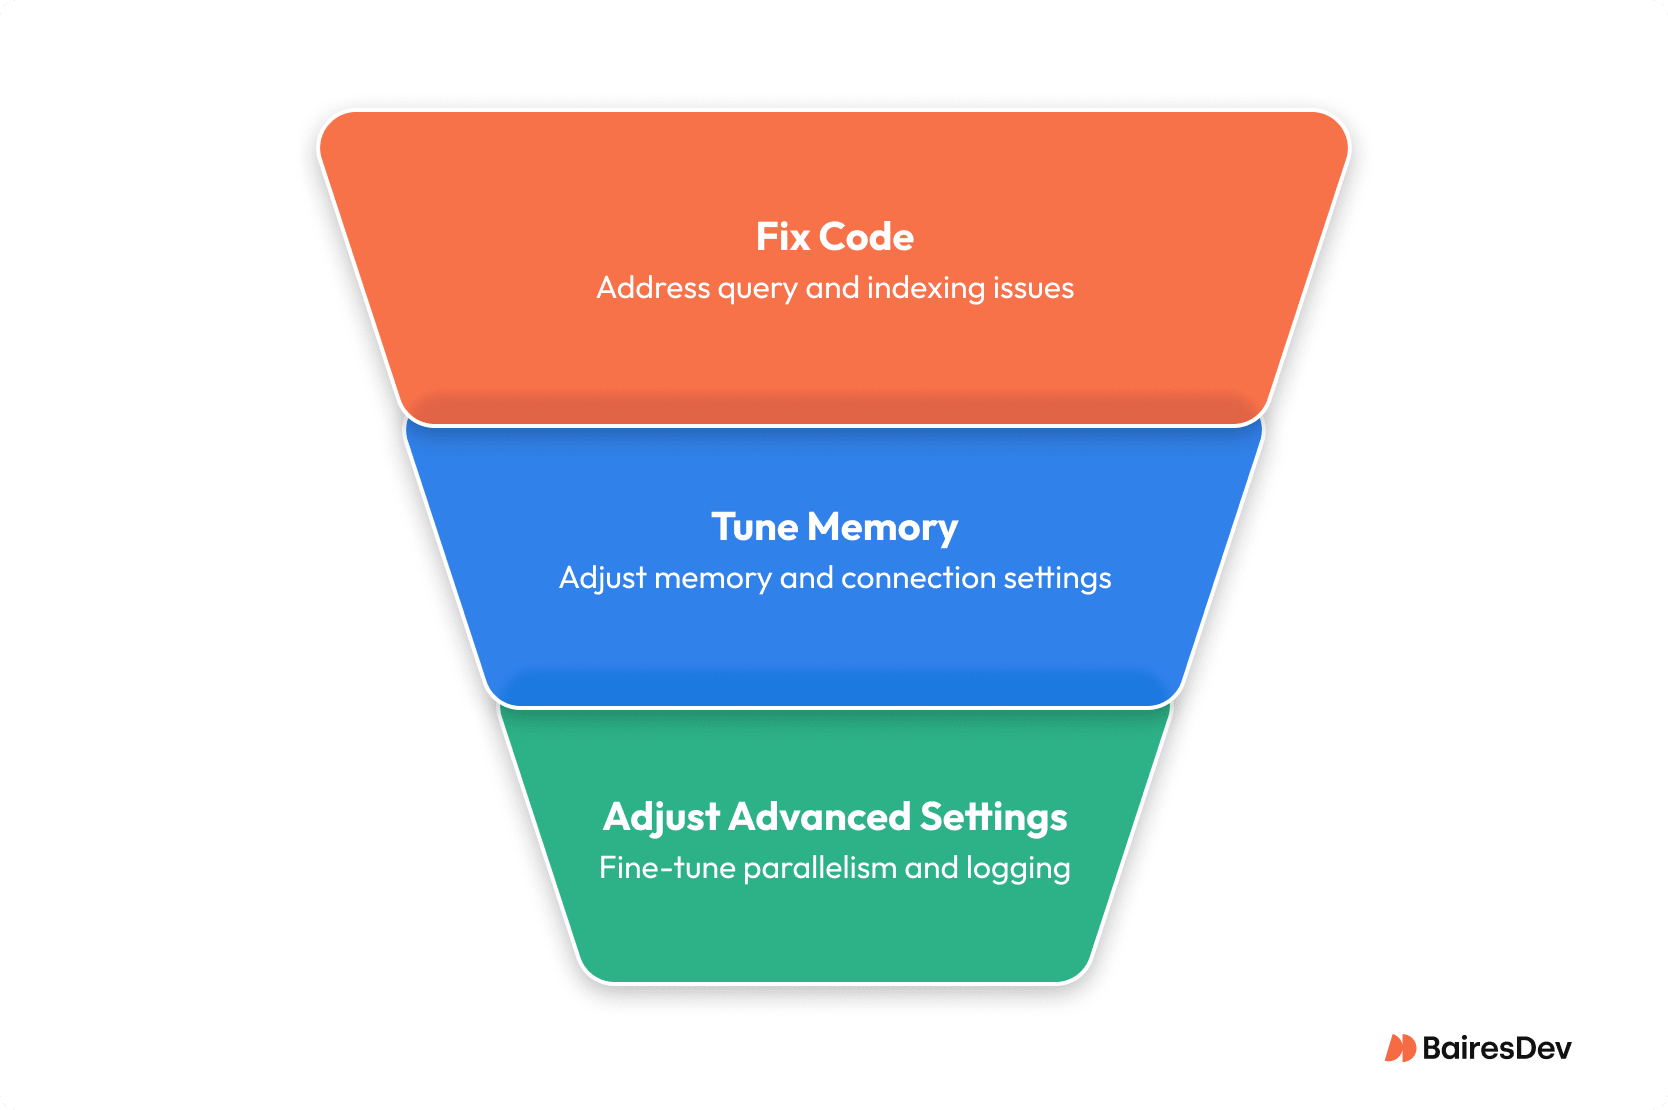
The hierarchy is simple:
- Fix the Code First. The vast majority of performance bottlenecks are in slow, un-optimized queries and a poor indexing strategy. This is the foundation for truly improving PostgreSQL performance, and this is where you will find the biggest wins.
- Then, Tune the Memory. Once your queries are sane, ensure your core memory and connection settings are reasonable so the database has the resources it needs to operate efficiently.
- Only Then, Touch the Advanced Settings. The other knobs for things like parallelism or write-ahead log behavior are for fine-tuning an already healthy system. They are not a substitute for a solid foundation.
This is a continuous process. Measure, change one thing, and measure again. Anything else is just guesswork.
Frequently Asked Questions
What are the most common indexing issues that affect PostgreSQL performance?
The most common indexing issues affecting PostgreSQL database performance are over-indexing and under-indexing. Over-indexing also means that PostgreSQL databases have unused indexes, all of which result in slow running queries, especially when the indexes exceed the size of the table itself. Under-indexing causes the query planner to opt for sequential scans which have poor performance metrics.
How do we start with query optimization when my team says a feature is slow?
Always start query optimization by getting the EXPLAIN plan for the poorly written query. Don’t tune the server. To truly improve PostgreSQL query performance, you must fix the code and indexing first; that’s where the real wins are.
How should we balance data integrity with the need for fast data retrieval?
Prioritize data integrity; a fast but wrong answer is a disaster. To speed up data retrieval, never compromise your core tables. Instead, build a separate read model, like a materialized view, to protect your source of truth while meeting performance goals.
How do we manage system resources for varying database load without just buying more hardware resources?
Don’t chase varying workloads by over-provisioning. Use a connection pooler to manage connection storms. Keep memory settings conservative globally and only increase them per-session for known heavy jobs. This stabilizes your overall resource usage without constant hardware changes.
For a new PostgreSQL server, which key parameters are most critical to review first?
For any PostgreSQL instance, focus on three key parameters that control memory: `shared_buffers`, `work_mem`, and `effective_cache_size`. Beyond that, the most critical choice is not one of the PostgreSQL parameters, but implementing a connection pooler to protect the PostgreSQL server.
As our data grows, when should we consider table partitioning for complex operations?
The trigger for table partitioning isn’t just when data grows. You should partition when routine maintenance, like adding an index to frequently queried columns, takes too long. This architectural change is necessary to keep performance predictable for your critical PostgreSQL data.
How can monitoring PostgreSQL lead to proactive performance improvements?
Proactive performance improvements come from specific signals. Monitor for queries being written to disk (low work_mem) and long query execution times. These indicate when SQL queries will degrade performance, allowing you to make targeted fixes before they impact users.


