

Engineering organizations gather, produce, and manage massive amounts of fragmented data: delivery metrics, incident logs, velocity trends, hiring throughput, and more.
Too often, this data is scattered across disparate tools, cluttered spreadsheets, or buried in raw logs. When relevant data isn’t accessible or clear, it often goes unused, leaving tech leaders to make critical decisions without benefit of the complete picture.
Enter Tableau. It empowers technical leaders to make faster, more informed decisions. Tableau is a business intelligence software that helps users transform raw data into actionable insights, with features like interactive data visualizations, dashboards, and advanced analytics.
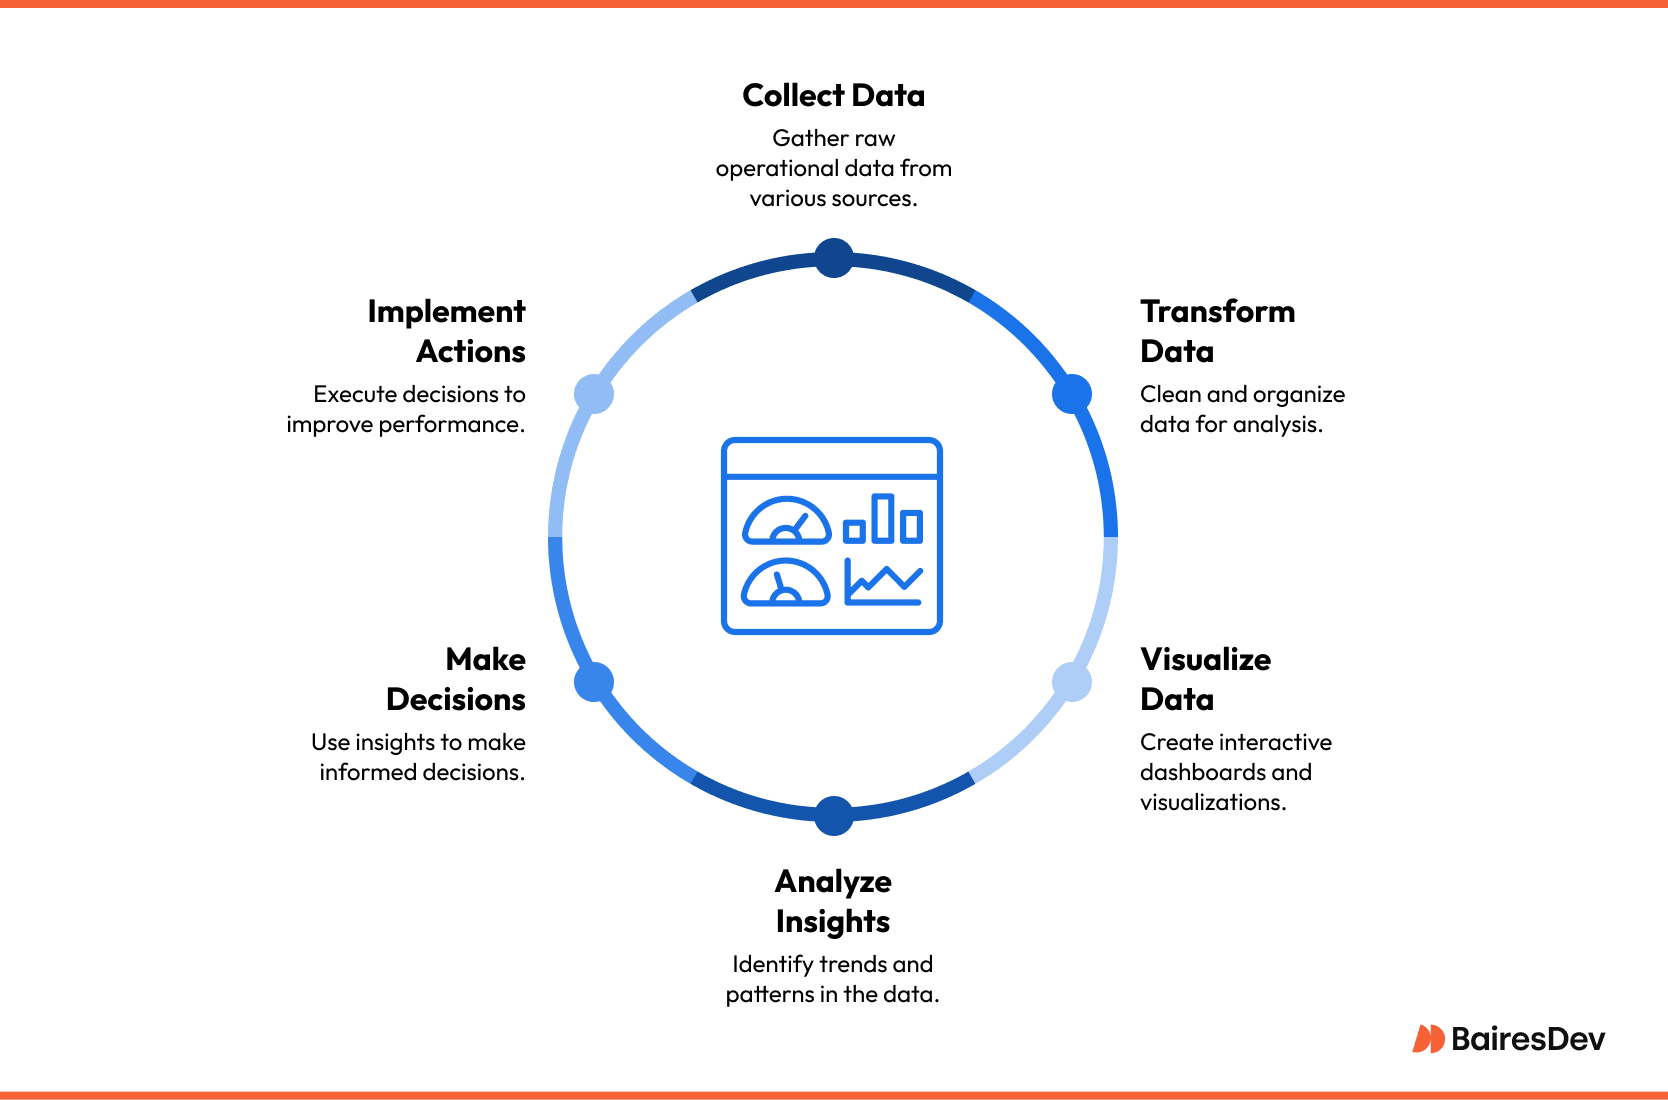
By transforming fragmented operational data into clean, interactive dashboards, Tableau provides a real-time view of the organization’s performance. You can quickly see what’s working, what’s slipping, and where to focus your team’s efforts.
The Business Context: Data-Driven Decision-Making for Tech Leaders
In a dynamic work environment, the obligation of reporting is easy to overlook during sprint planning. Nonetheless, stakeholders—from the executive suite to cross-functional teams—count on us to provide transparent insights: Are we on track? Where are we blocked? Are we improving?
This is where Tableau fits into the engineering workflow. It’s more than just a modern Business Intelligence (BI) tool for data analysts. For engineering leadership, it’s a platform that cuts through the noise, surfacing just what we’re looking for, be it trends, patterns, anomalies, correlations, or root causes.
When ad hoc reporting becomes cumbersome or inconsistent, Tableau delivers consistent clarity and actionable insights at scale.
What Is Tableau, for Engineering Leaders?
User-friendly Tableau offers BI tools designed for speed, clarity, and enterprise scale. Its high user satisfaction is well-documented; for instance, in July 2025, Crozdesk showed Tableau’s user satisfaction rates to be 88 out of 100 in the Business Intelligence category.
It connects you to your tools (e.g., Jira, GitHub, Datadog, Microsoft Excel, etc.) and lets you build powerful data visualizations without writing code. It can handle remarkably large datasets, making it an effective tool for reporting and analysis across large engineering organizations.
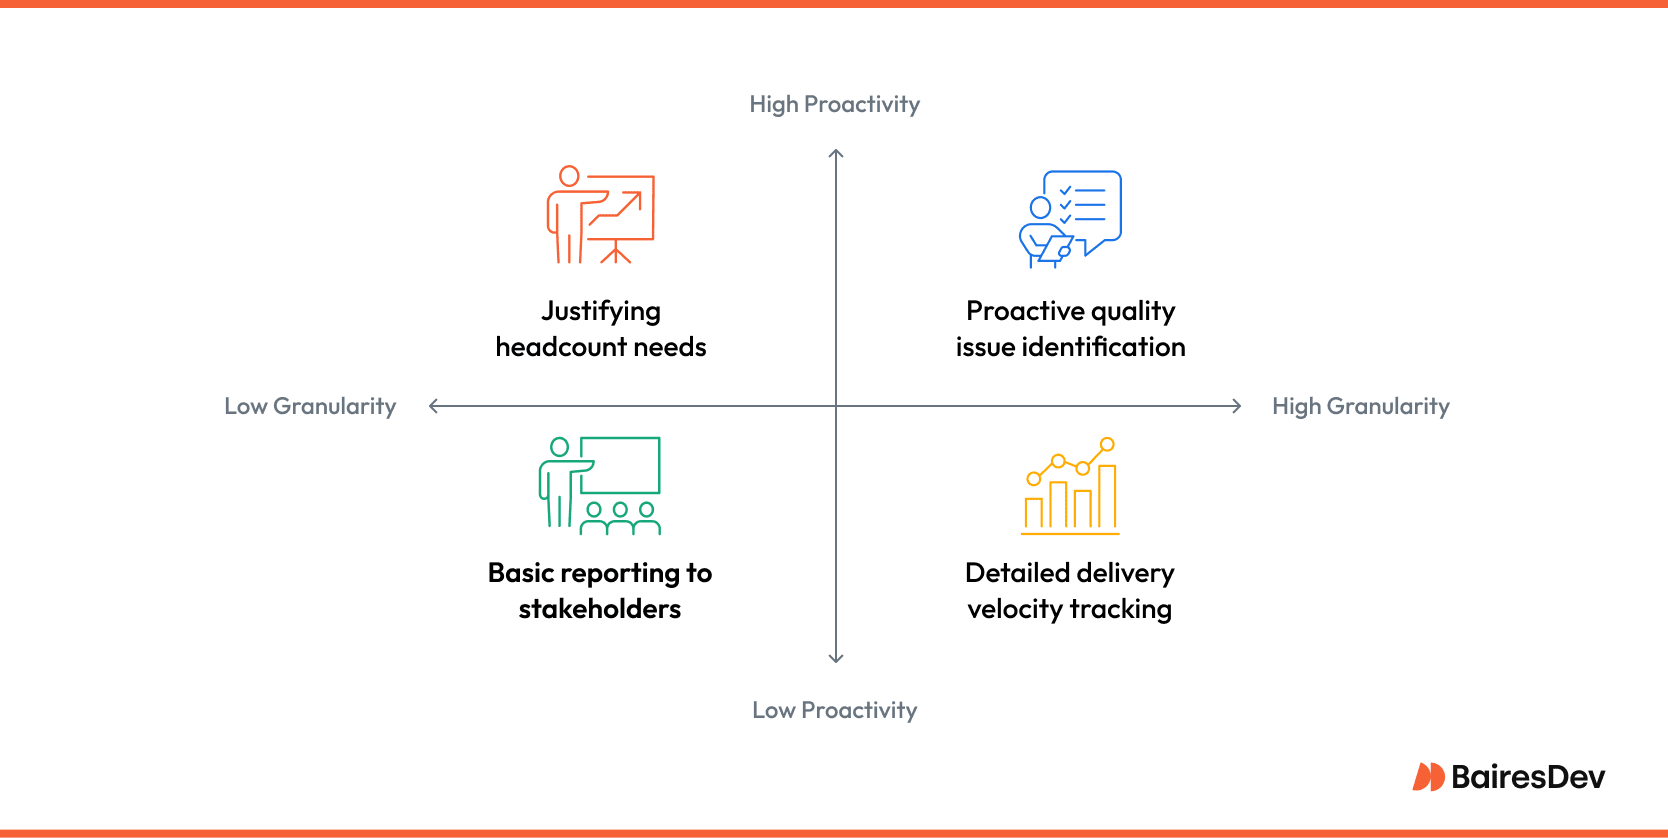
Engineering leaders can use Tableau to:
- Track delivery velocity by team, initiative, or epic, gaining granular insight into progress.
- Identify quality issues proactively, preventing them from escalating into emergencies.
- Justify headcount needs with data-backed historical throughput and backlog growth.
- Report and communicate concisely to non-technical stakeholders, fostering alignment.
Ultimately, these capabilities are less about generating static charts and graphs and more about providing dynamic, actionable visibility.
Real Use Cases from the Field
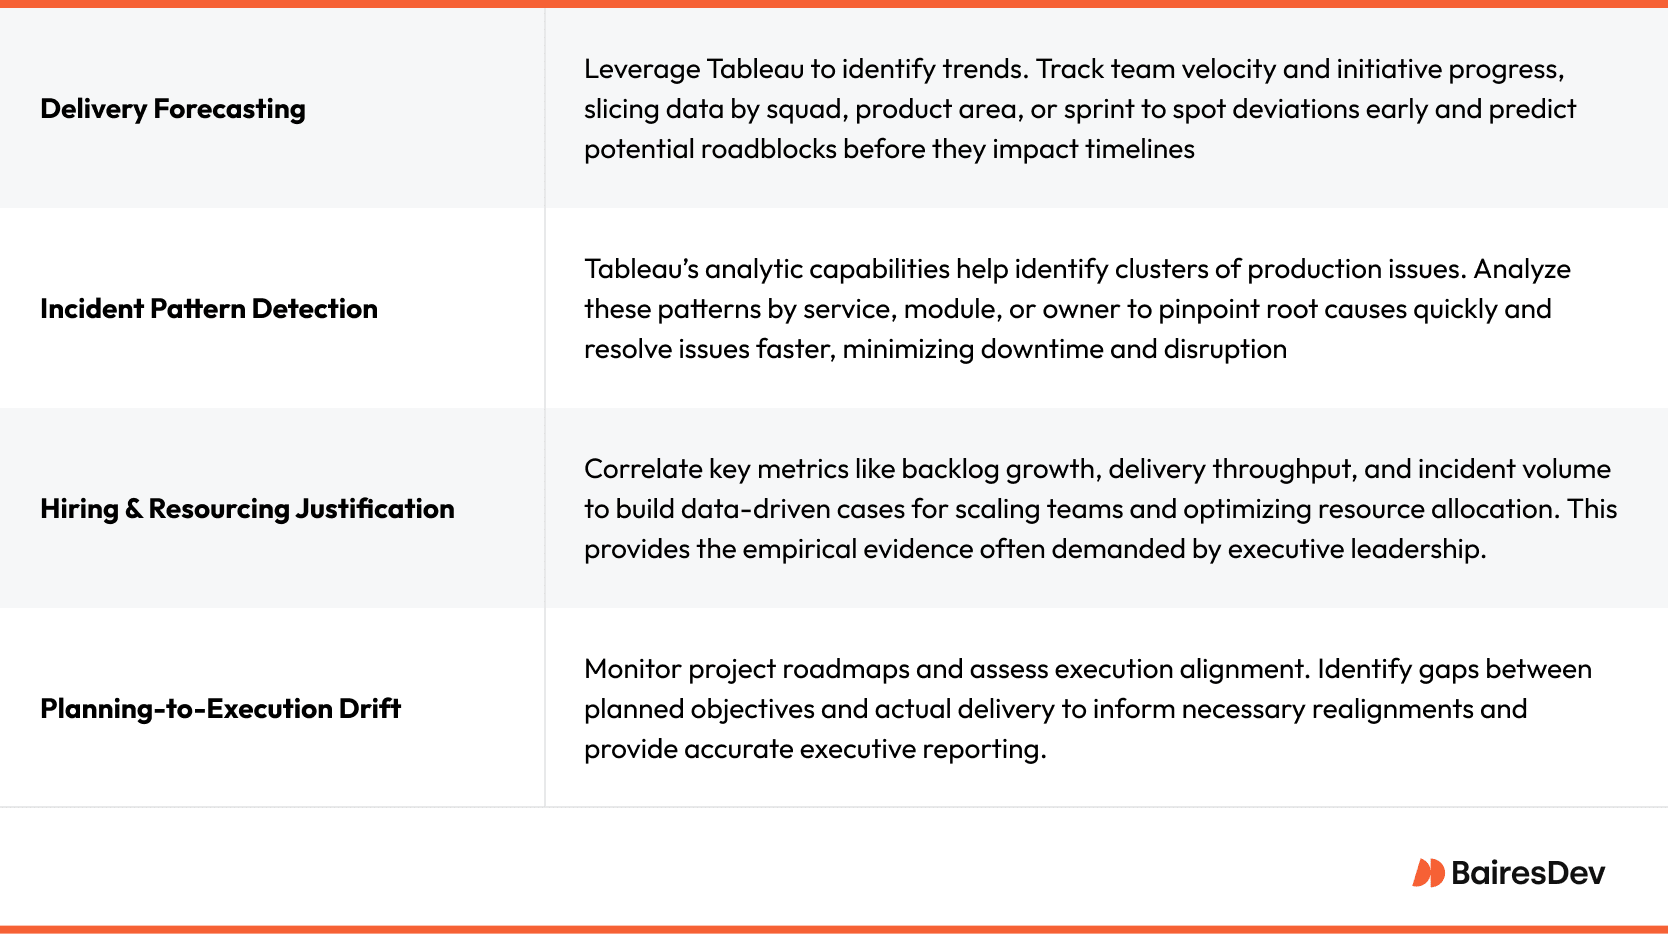
Tableau’s power extends beyond traditional data analysis; it’s a strategic asset for leadership.
It enables you to move beyond guesswork and make data-driven decisions with confidence. Here are some primary examples of its practical applications:
Implementation: The Reality Behind the Dashboards
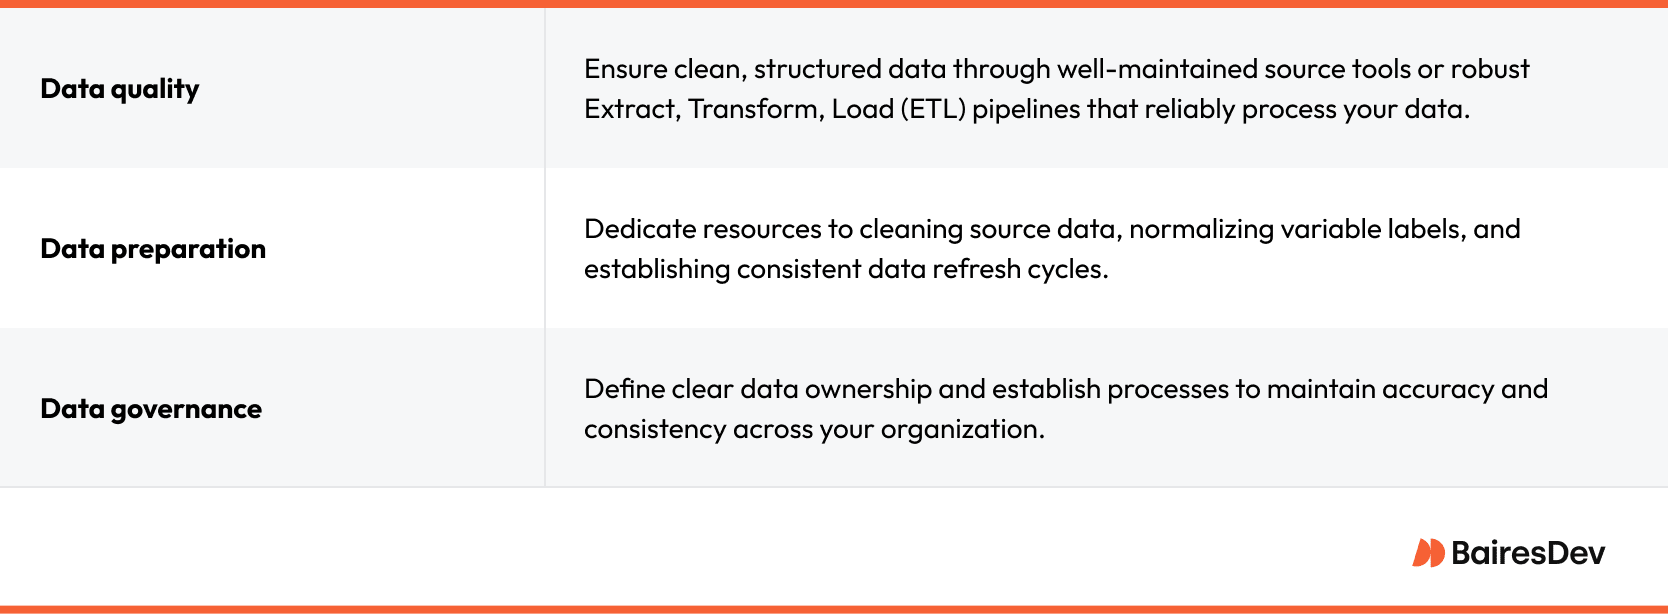
Tableau is only as good as the input it receives. Its effectiveness is directly proportional to the quality of data provided.
If the underlying data is inconsistent or incomplete, your insights will be flawed. Tableau works best with high-quality, clean, and structured data. This requires diligent attention to:
Clean implementation leads to unlocking Tableau’s full potential and achieving:
- Accurate, actionable insights
- Reliable decision-making
- Data-driven success
Investing in these fundamental practices will ultimately determine the ROI on your Tableau implementation.
Best Practices for Tableau Governance in Engineering
An ungoverned Tableau setup can quickly become a data swamp. As you scale, you don’t need a massive rulebook, but you do need to get a few basics right to keep things clean and trustworthy.
Think about three things: who can touch what, who owns what, and how fresh the data is.
Use role-based access—most people should only be viewers. Then, assign a clear owner to every critical dashboard. If no one owns it, no one will trust it. Finally, be transparent about your data.
For example, a simple note on the dashboard explaining where the customer data comes from and its refresh rate (daily, hourly, etc.) solves a world of confusion.
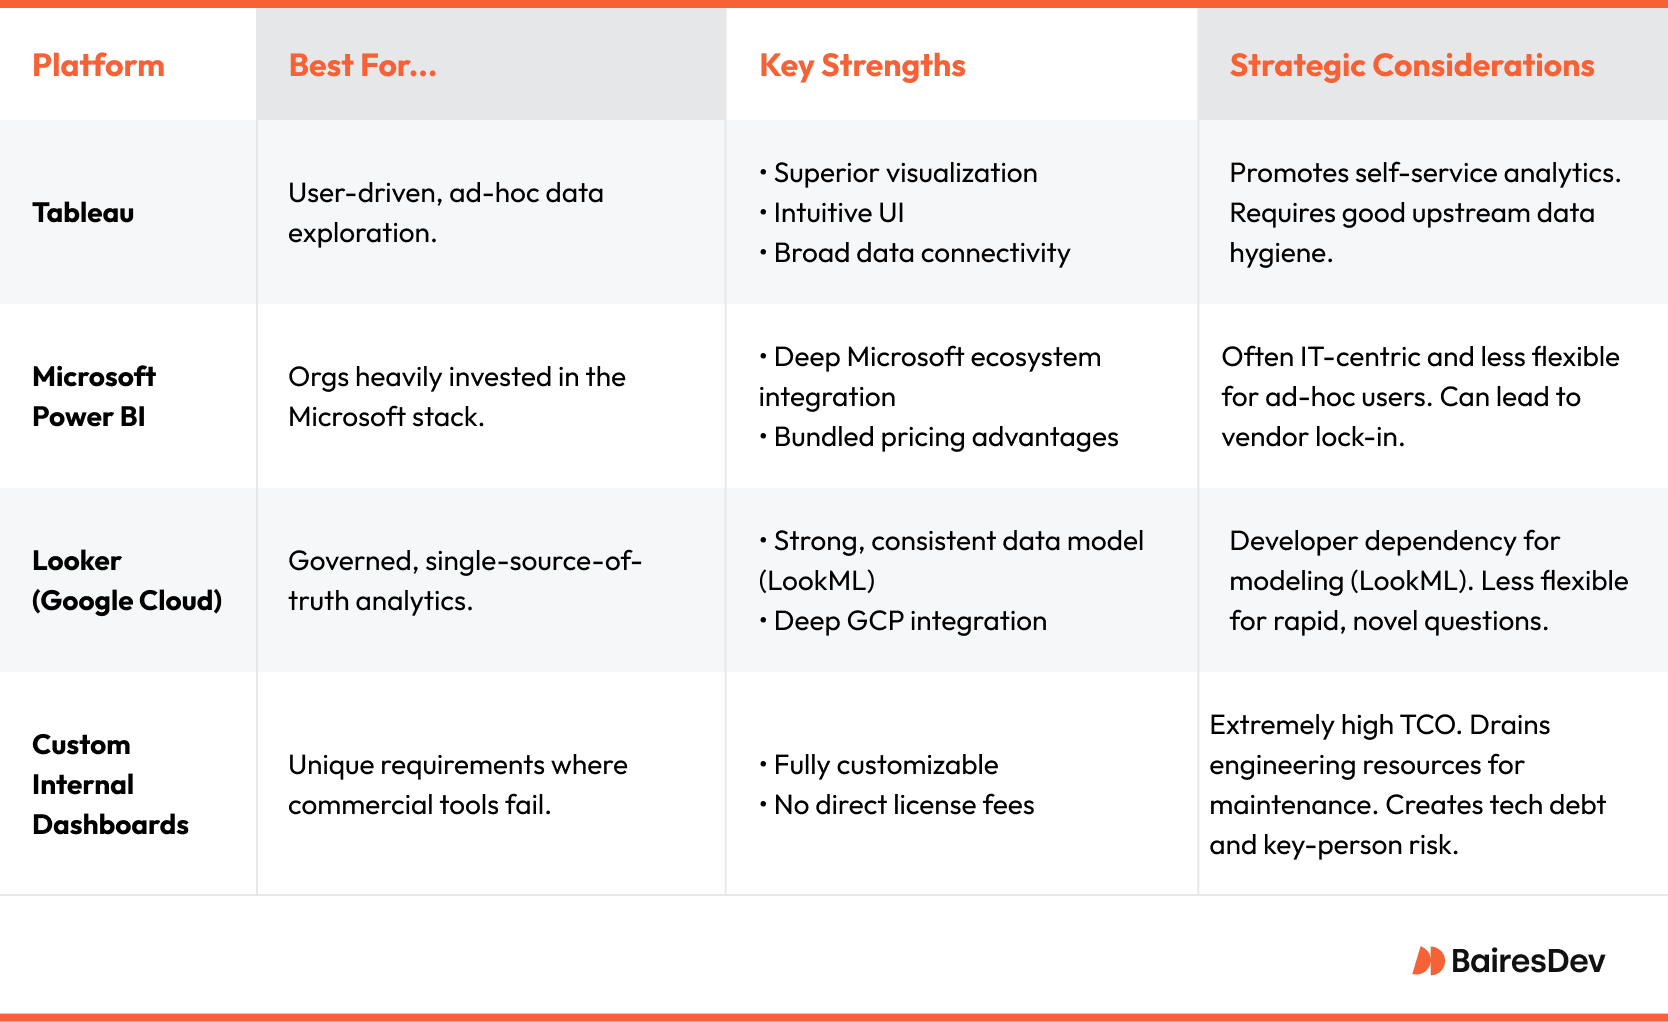
How Tableau Compares to Common Alternatives
Choosing a BI platform is a strategic decision that shapes how your organization interacts with data.
While Tableau is a leader in user-driven analytics, it exists in a landscape of strong alternatives. The right choice depends less on a feature-for-feature checklist and more on your organizational structure, existing tech stack, and long-term data strategy.
For engineering leaders, the evaluation must go beyond sticker price to include total cost of ownership (TCO), maintenance overhead, and the speed at which your teams can get actionable answers.
Here’s a high-level comparison for leaders:
From Metrics to Meaning
Engineering leaders don’t need more data, they need faster access to the right data. Tableau delivers that edge. It cuts through system noise, consolidates fragmented reporting, and provides leaders with the visibility needed to support faster, more defensible decisions.
When used well, Tableau becomes more than just a BI tool. It’s a strategic analytics platform that enables engineering leaders to stay aligned with the business, justify strategic decisions, and navigate uncertainty without stalling execution. According to Number Analytics (March 2023), companies that leverage data-driven decision-making are 6% more profitable than their competitors.
In fast-moving environments, that level of clarity is essential.
Frequently Asked Questions
Is Tableau only for data analysts or data scientists?
Not at all. While analysts and data scientists often build the foundational data sources, Tableau is designed for leaders to explore data. You can easily interact with dashboards, filter views, and get answers without writing a single line of code.
What data sources does Tableau integrate with?
Pretty much everything your engineering and business teams already use. Tableau has native connectors for hundreds of platforms, including the big ones like Jira, GitHub, Datadog, Snowflake, Salesforce, and of course, standard sources like Google Sheets and Excel.
Can Tableau replace custom internal dashboards?
In most cases, yes—and it’s often a smart move. Building and maintaining custom dashboards drains your engineering resources. Tableau can usually provide the same (or better) insights while freeing up your team from that maintenance burden. You get more features and better usability without having to support another internal tool.
How long does a typical Tableau implementation take?
It depends on the complexity, but you can get started surprisingly fast. If your data is already clean and accessible, a basic implementation can be up and running in just a few weeks. For a more complex, enterprise-wide rollout that involves significant data cleanup and integration, it’s more realistic to plan for a couple of months.
Do I need to hire a Tableau developer?
Not necessarily, especially at first. Your existing analysts or even a tech-savvy manager can often handle initial dashboard creation. However, as you scale and your reporting needs become more complex, having a dedicated Tableau expert or bringing in professional services can be a game-changer for getting the most out of your investment.
Is Tableau suitable for enterprise environments?
The Tableau platform is designed for larger companies. It has everything you’d expect: granular role-based access controls, secure integration with your existing systems (like your identity provider), and robust data management features designed to meet compliance standards.
Is Tableau Prep Builder a useful tool for engineering leaders?
You probably won’t use it yourself, but you’ll benefit from it. Tableau Prep Builder is the tool your data team uses to do the critical upstream work of cleaning and combining messy data from different sources. Its main job is to ensure the data flowing into your dashboards is clean and reliable, which makes everyone’s life easier.


