

When Java performance issues arise, teams look to JVM tuning or scaling as a first fix. Leaders know the real answers lie elsewhere: in topology, traces, boundaries, and governance. Visibility and standards drive development toward stability and performance, not flags and instance sizes.
JVM symptoms are easy to measure: GC pauses, heap pressure, blocked threads, and CPU strain. But these runtime signals are just that: symptoms. A JVM behaves poorly when the service using it is under duress. The hard work happens while finding the root cause.
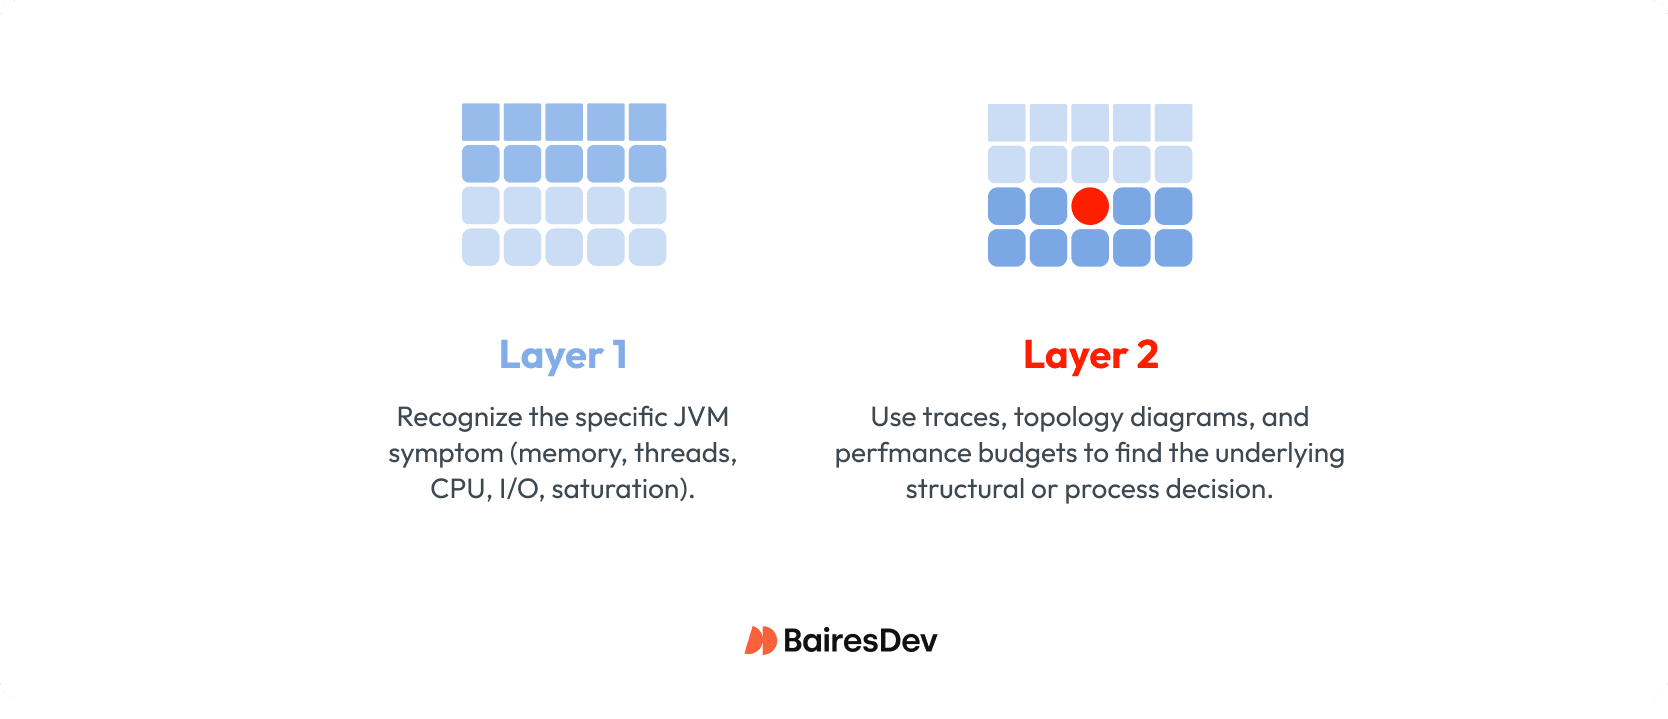
That’s why performance investigations work best when leaders separate diagnosis into two layers:
- Java symptom triage: Identify the symptom pattern in the JVM: memory, threads, CPU, I/O, or saturation.
- System root cause analysis: Use traces, topology diagrams, and performance budgets to pinpoint the structural or process decision that generated the symptom.
This two-layer model shifts the organization from “fixing the JVM” to “fixing the architecture,” where the real performance gains are found.
Layer 1: Java Performance Symptom Triage
JVM metrics are often the first signals anyone notices when performance degrades. These numbers are concrete and visible, which makes them tempting targets for tuning. But the JVM is not where performance problems begin—it’s simply where the system’s stress becomes measurable.
The purpose of Layer 1 is to classify the symptom pattern so leaders can direct teams toward the system-level causes. Don’t allow expensive upgrades until analysis proves them necessary.
Leaders don’t need deep JVM expertise to interpret these signals. They only need to recognize which category of strain the runtime is reporting, because each category points to a different kind of architectural issue.
Memory and heap pressure
Memory duress shows up as follows:
- Aggressive garbage collection
- Frequent allocation churn
- Growth in retained objects
- Service restart due to out-of-memory errors
Before concluding the machine needs more memory, take a deeper look. You’ll often find the service is pulling too much data over the wire, creating too many temporary objects per request, or repeatedly hydrating data structures that should have been cached.
Thread pool saturation
Thread duress shows up as:
- Blocked worker threads
- Timeouts by callers into a service
- All available threads engaged while work backs up
The first reflex is to add more and bigger cores to the machine. Instead, insist that teams identify why the threads are not processing as expected.They may find slow network calls, hidden dependencies, and unbounded retries that stop the service from making progress.
CPU strain
CPU duress shows up as:
- Sustained CPU usage at 80 to 100 percent
- High contention of threads for cores
- CPU throttling
Teams might rush to rewrite “inefficient” code or scale vertically. But first, review the service’s intended role versus what it’s now doing. Shortcut changes may have saddled it with aggregating multiple downstream calls, merging large payloads, or performing heavy transformations.
I/O wait
Waiting duress is the inversion of CPU duress:
- Low CPU usage
- Low contention of threads for cores
- Throughput plateaus or drops
The service isn’t overloaded computationally, it’s simply waiting on calls that take too long, such as database query performance and slow transaction partners.
Summary
The key insight for leaders is this: JVM symptoms tell you where a service is under duress, not why. Runtime behavior is a downstream expression of architectural decisions.
Leadership lever: Make sure dashboards show JVM and latency metrics in correlation with system behaviors, such as user events, database load, and HTTP and message volume. These make problems easier to spot.
Once your teams identify the runtime pattern, the investigation should move immediately to the second layer—examining call traces, service topology, data flow, and the design decisions that created the pressure in the first place.
Layer 2: System Root Cause Analysis
JVM stress always originates from a decision made upstream. The runtime can tell you where the service hurts, but only the architecture and design can tell you why.
Once leaders classify the symptom pattern, the next step is to examine the system behaviors that commonly create memory pressure, thread blocking, CPU strain, or I/O wait. These architectural causes are well known, but they’re often invisible until traced explicitly.
Fragile or Chatty Service Boundaries
Services that call each other repeatedly, exchange oversized payloads, or rely on helper services create avoidable work under load. These boundaries turn simple requests into long chains of synchronous calls that tie up threads and inflate object allocations. The JVM reports thread blocking or heap churn, but the root cause is boundary design.
Leadership lever: Require call traces for any latency-related incident and block new APIs that increase fan-out without justification.
Topology Drift and Hidden Dependencies
Over time, integrations accumulate: a new helper service, a convenience API, an acquisition with different patterns. A once-clear topology becomes a mesh of synchronous fan-out and accidental coordination. When a request traverses five or six services before doing real work, the JVM sees slow dependencies and long I/O waits.
Leadership lever: Mandate updated topology diagrams before major work begins and freeze changes when diagrams are out of date.
Data Access and Payload Pathologies
Duplicate reads, unbounded hydration of domain objects, and inflated payloads contribute directly to GC churn and CPU strain. When services repeatedly fetch the same data from downstream systems—or worse, reconstruct large objects on every request—the runtime absorbs the cost. These aren’t GC problems; they’re data flow problems.
Leadership lever: Establish payload size budgets and introduce caching standards at the platform level.
Organizational Boundaries Driving Architectural Boundaries
Teams often split services along reporting lines instead of domain boundaries. The result is “org-chart architecture”: narrow services with shared data contracts, helper components no one owns, and workflows that require multiple teams to coordinate changes. This pattern drives thread blocking (waiting on dependencies), CPU spikes (services becoming accidental orchestrators), and memory pressure (duplicated transformations).
Leadership lever: Treat tightly coupled services as a cluster, with shared interface and shared contract, even if ownership spans teams.
Summary
These structural forces create the conditions where runtimes struggle. Once leaders understand how these patterns manifest as runtime symptoms, they can redirect teams away from tuning flags and toward architectural fixes that resolve the real source of the strain.
Use your leadership levers as governance. This challenges the teams to dig deeper for optimal diagnoses that lead to accurate root cause analysis.
How Leaders Steer Teams Toward Systemic Fixes
When a Java service slows down, developers naturally begin with what they can see: heap usage, GC logs, thread dumps, CPU graphs. But leaders must redirect the investigation toward the system behaviors that cause these symptoms.
This shift only happens when leadership puts guardrails in place that make systemic analysis the default, not the exception. Effective performance management grows from governance applied with discipline, not heroic debugging.
Require Visibility Before Action
Teams cannot fix what they cannot see. Many performance investigations stall because the data required to diagnose the upstream cause simply doesn’t exist. Leaders should insist on a minimum set of visibility standards across all Java services:
- Request, dependency, and error tracing
- Saturation dashboards (threads, CPU, heap, I/O)
- Clear inbound/outbound call maps
- Payload size and frequency metrics
With this visibility in place, teams stop speculating about root causes and start demonstrating them.
Leadership lever: Block performance-related work until visibility requirements are met.
Enforce Performance Budgets
Treat latency, error rates, and saturation thresholds as constraints. When teams know the limits they must operate within, they design boundaries, data flows, and scaling strategies accordingly. Without budgets, “acceptable performance” becomes a team-by-team subjective measure.
Leadership lever: Tie deployment permissions to meeting latency and saturation budgets.
Trigger Architectural Review Based on Measured Conditions
Architectural reviews should occur automatically when measurable thresholds are crossed. These triggers prevent architectural drift from accumulating silently until it becomes a crisis:
- A service exceeds its latency budget
- Call traces show fan-out beyond a defined limit
- Team adds a new downstream dependency
- Payload size grows beyond the approved envelope
Applying governance keeps everybody honest, and gives architects a fair framework for enforcement.
Leadership lever: Make review triggers part of the platform contract for all services.
Standardize Remediation Patterns
When every team invents their own solutions, systems grow unevenly and regress frequently. Leaders can accelerate healthy system evolution by establishing a small set of approved remediation patterns with clear entry and exit criteria:
- Clusters
- Modular monoliths
- Async messaging
- Caching
- Edge aggregation
This removes debate and replaces it with predictable, auditable choices that architects can enforce evenly across all teams.
Leadership lever: Adopt a “pattern first” approach, where teams justify deviations, not conformance.
Summary
Leadership transforms performance work from reactive debugging into disciplined engineering. By enforcing visibility, budgets, review triggers, and standard remediation patterns, leaders ensure teams focus on structural solutions that eliminate the root cause of JVM symptoms — not temporary runtime patches.
Leaders’ Remediation Playbook
Once teams can separate JVM symptoms from architectural causes, they need a structured way to move from observation to action. Without a repeatable playbook, performance work becomes guesswork with uneven outcomes: one team adds caching, another rewrites a service, another tunes GC flags.
Leaders prevent this fragmentation by providing a clear sequence of steps that every team must follow when investigating or remediating performance issues.
| Step | What to capture | Gate to move on |
| 1. Classify the runtime pattern | Duress category (memory / threads / CPU / I/O) + 2–3 supporting charts | Symptom pattern written down in the incident/RCA before any fix is proposed |
| 2. Trace the pressure upstream | One representative trace + call path + top 1–2 slow dependencies | Trace evidence points to a specific upstream behavior (fan-out, payload, slow dependency, retries) |
| 3. Choose a standard remediation pattern | Selected pattern (cache, async, edge aggregation, cluster, modular monolith) + one-sentence rationale | Pattern matches the verified cause; exceptions are explicitly justified |
| 4. Prove it under load against budgets | Budget results (latency / errors / saturation) under realistic load | Budgets pass at target load; regression risk documented if partial |
| 5. Lock it in with docs and checks | Updated topology/dependency map + runbook/change trigger updated | Artifacts updated and review triggers reflect the new design |
Step 1: Classify the Runtime Pattern
Start with what the JVM is telling you: memory pressure, thread blocking, CPU strain, or I/O starvation. This classification doesn’t fix the problem, but it determines where to look next. Teams should document the symptom pattern explicitly before proceeding.
Leadership directive: Every incident report must begin with the runtime duress category, not a proposed solution.
Step 2: Map the System Behavior That Creates the Pressure
The second step correlates the symptom pattern with likely architectural causes: fan-out, chatty boundaries, heavy payloads, slow dependencies, or org-chart-driven service fragmentation. This mapping should rely on traces and topology diagrams, not assumptions.
Leadership directive: Require teams to provide trace evidence that links the symptom to the structural cause.
Step 3: Select a Remediation Pattern from an Approved Set
Rather than improvising, teams choose the remediation that best fits the cause:
- Cluster: When services share data and drift out of sync.
- Modular monolith: When multiple services duplicate logic or share the same lifecycle.
- Async messaging: When synchronous call chains block threads or magnify latency.
- Caching: When repeated data hydration drives CPU or GC stress.
- Edge aggregation / BFF: When front-end variation forces backend chattiness.
This keeps solutions consistent and avoids redesigns that fix one problem while creating three new ones.
Leadership directive: Teams justify exceptions to patterns, not adherence.
Step 4: Validate with Budgets and Load Conditions
After remediation, the service must prove it can meet its latency, error, and saturation budgets under realistic load. This ensures structural fixes behave as expected and prevents regressions caused by refactoring or premature deployment.
Leadership directive: No deployment of a remediation change until budgets are verified under load.
Step 5: Update Topology and Governance Artifacts
A remediation is not complete until the architecture is documented and governance checks are updated. Otherwise the system drifts again, often in the same direction as before.
Leadership directive: Changes are not “done” until diagrams, dependency maps, and budgets reflect the new design.
Summary
This playbook ensures that every performance effort follows the same disciplined workflow: classify the symptom, verify the cause, apply a standard pattern, validate the outcome, and update the system’s knowledge base. Leaders who enforce this sequence prevent random fixes and guarantee that performance improvements become durable, scalable architecture choices.
Leaders Don’t Tune JVMs, They Shape Systems
Java performance problems rarely begin in the JVM. They begin in the system around it. The JVM simply reports the stress. Your job as a leader is to treat those symptoms as architectural signals, the organization resolves the root cause.
The two-layer model—runtime triage followed by system diagnosis—gives leaders a way to steer teams toward those deeper causes with discipline rather than guesswork:
- Visibility becomes non-negotiable
- Budgets create guardrails
- Trace evidence replaces intuition
- Remediation follows standard patterns instead of improvisation.
Performance improves not when the runtime is tuned, but when the architecture is aligned, governed, and designed to handle real-world load. That’s where lasting velocity—and lasting reliability—come from.


