Izcóatl is a technology leader with 30+ years of experience architecting software solutions and scaling global engineering teams. He architected Sky's AI-driven media platforms and developed blockchain gaming features at Yuga Labs. At BairesDev, he serves as AI/ML Circle Leader, driving internal research and development communities.



Key points
- One synchronous operation on Node’s main thread stalls every in-flight request until it completes.
- Main-thread blocking and thread-pool saturation produce identical external symptoms; diagnosing each correctly determines the right fix.
- Scaling out after a latency incident often hides a blocking code path that the team will pay to replicate across every new replica.
The event loop delegates I/O to the operating system or a thread pool and processes the callbacks on a single thread, cycling through the event loop phases to pick up whatever work is ready. The design gives you concurrency rather than parallelism. It also means one piece of synchronous work can hold the thread and stall everything else in flight.
With Node.js, a single-threaded runtime is put to work managing thousands of connections at once. The runtime offloads asynchronous tasks to the OS or the thread pool and then executes the callbacks when the results are in; it is an efficient way to deal with I/O-heavy demands without incurring the memory cost of a thread for each request.
That design has a downside. A single synchronous task on the main thread will bring all in-flight requests to a halt, even as the infrastructure dashboard reports nothing but healthy CPU and memory figures.
Some teams treat the event loop as a black box and simply scale horizontally to compensate. They end up with more processes, yet the bottleneck remains in each one. Distinguishing a capacity problem from a per-process execution bottleneck is the first diagnostic step.
The Event Loop Trades Parallelism for Concurrency, and That Trade Has Limits
There is a single thread in the event loop that makes its way through a predetermined sequence of phases: timers, pending callbacks, poll, check, and close. It will run all callbacks that are prepared in a given phase, including each setImmediate callback queued in the check phase. Of these, poll is the significant one, since it is where the loop picks up on finished I/O and executes the associated callbacks. When the thread is held up for even a few milliseconds, all the phases in its wake are put on hold.
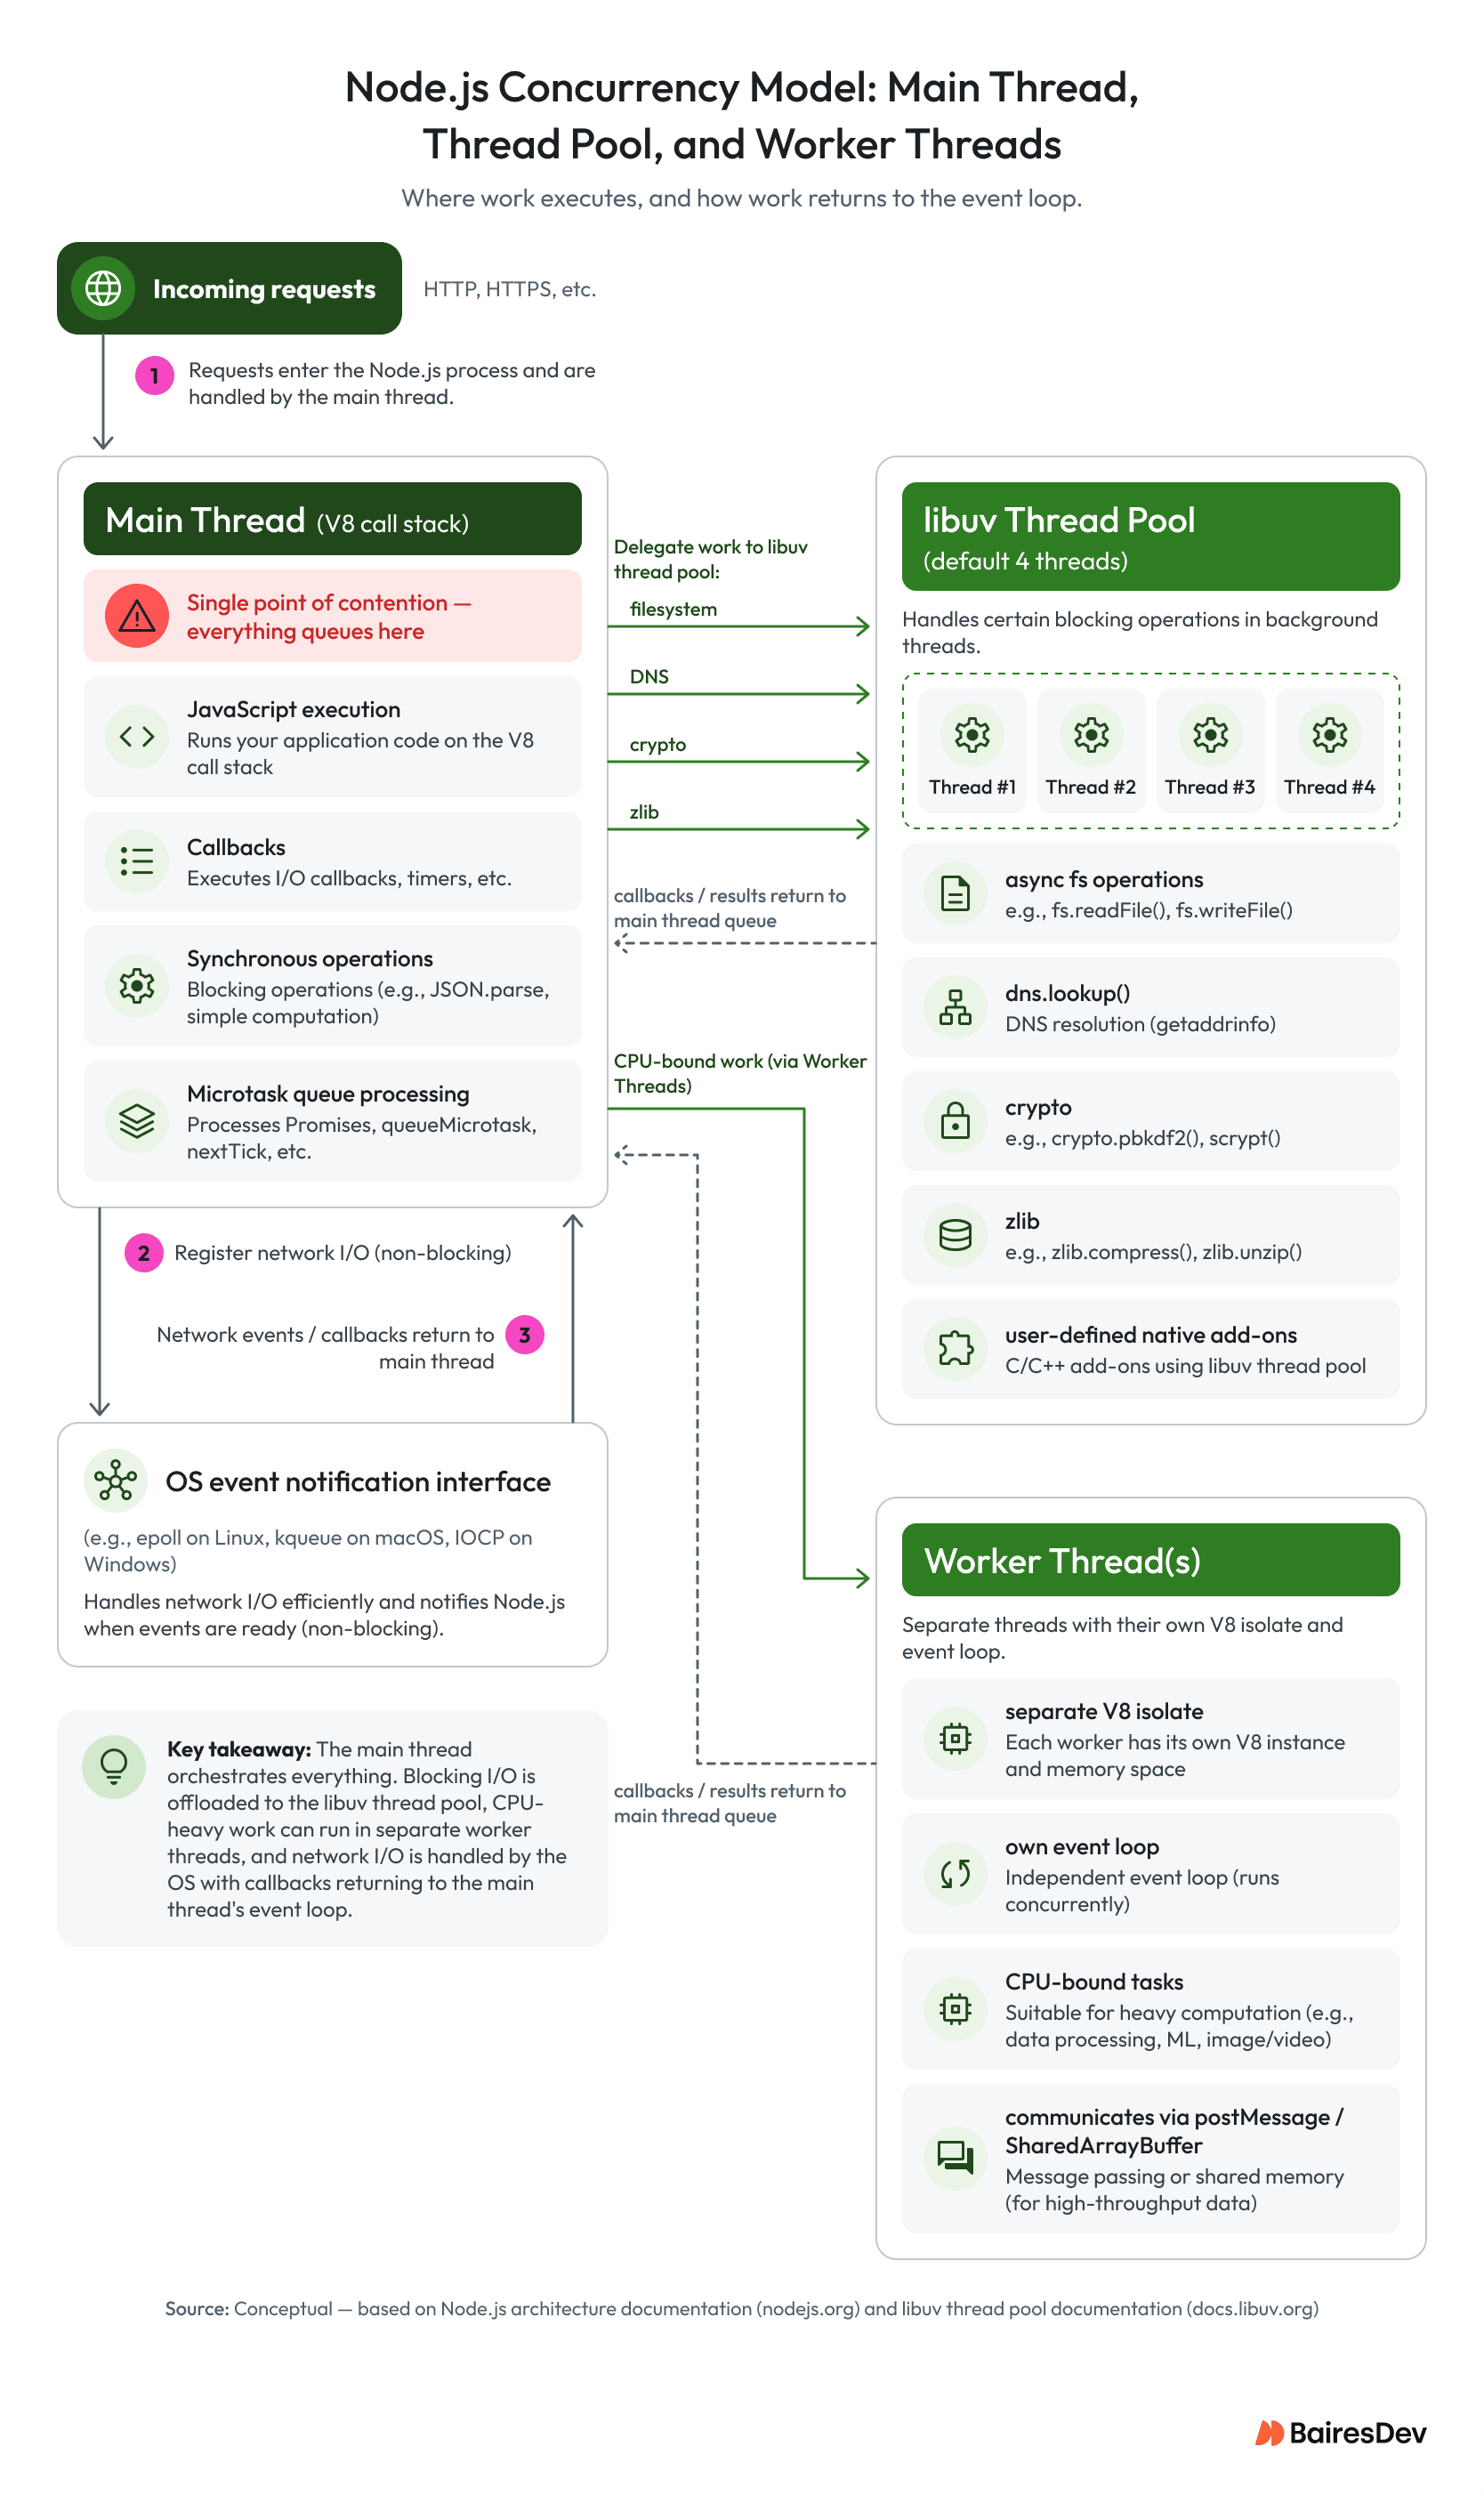
This is also the thread where the event loop executes all JavaScript, from application logic to callbacks. Network I/O gets registered with the operating system’s event notification interface, epoll on Linux, kqueue on macOS and IOCP on Windows. Filesystem operations, dns.lookup(), and selected crypto and zlib work go to libuv’s worker pool instead. That kind of delegation is the key to making throughput dependent on I/O concurrency.
The model breaks down when something keeps the main thread busy. Any synchronous work that runs while the loop is working through pending callbacks, such as a heavy JSON.parse or a synchronous file read, will have that effect. So will a regular expression with catastrophic backtracking or an intensive computational loop. Each example ties up the thread for its full duration while every queued callback waits.
Microtask queues make this problem worse. The queue drains completely after every callback, including any setTimeout callback, so a chain that keeps scheduling itself can hold the loop indefinitely. This has the effect of starving I/O callbacks without showing the telltale CPU spike, which is why it is not easy to detect.
How a Request Moves Through Node.js
The following describes the path a single asynchronous operation takes.
- A request arrives. Node invokes the JavaScript handler on the event loop thread, and V8 executes it on the call stack.
- The handler reaches an asynchronous call and hands off async operations: network calls to the operating system, pool-backed work to libuv.
- The call stack empties, and the thread moves on to whatever callbacks are already runnable.
- The operation completes. The kernel or the worker pool signals libuv, which queues the callback or promise continuation.
- The event loop processes that queue on its next pass and V8 runs the callback. Same thread that started the request.
Step five is where it gets fragile. The I/O finished on schedule, but the callback still waits until the thread is free. A slow synchronous operation anywhere else in the process delays event loop work that already completed.
Three Execution Modes Define Three Risk Profiles
There are three venues for work within the process: the main thread, a worker thread or the libuv thread pool. Registered network I/O sits outside all three, which is easy to forget. All three have their share of production risk to contend with.
The runtime is designed around non-blocking I/O as the standard, and asynchronous code is the expected pattern throughout. Event-loop blocking is the failure mode. This is what happens when the main thread is occupied by something like a synchronous call to the file system, zlib or crypto and all the runnable callbacks are left waiting.
As for worker threads, they execute JavaScript in their own V8 isolates but remain in the same process. They are allotted an event loop of their own and can make use of shared memory instead of having to copy it. The docs are plain on the matter of scope: these workers are meant for JavaScript that is CPU heavy. For I/O, Node’s asynchronous path is already more efficient.
Table: Execution Mode Risk Comparison
| Dimension | Non-Blocking I/O | Event-Loop Blocking | Worker-Thread Execution |
| Where Work Executes | OS event notification interface or libuv thread pool | Main thread (call stack) | Separate V8 isolate and thread |
| Effect on Main Thread | Available during the wait; callbacks still execute there | Fully occupied for the duration | Free during execution; result arrives via message |
| Appropriate Workload | Database queries, HTTP calls, file reads, network fan-out | None; the failure mode to avoid | CPU-intensive transforms, image processing, cryptography, ML inference |
| Ideal Use Cases | API gateways, WebSocket servers, read-heavy microservices | None; every instance is a defect to remove | Media pipelines, batch transforms, ML scoring tiers |
| p99 Latency Impact | Minimal; scales with I/O round-trip time | Inflates p99 through queueing; grows non-linearly as event loop utilization rises | Keeps CPU work off the main loop; message transfer and CPU contention still affect end-to-end latency |
| Horizontal Scaling Behavior | Scales proportionally; adding instances adds I/O concurrency | More processes hide the blocking workload; they do not remove it | Scales independently; worker pool size tunable per service |
Sources: Node.js About, Don’t Block the Event Loop, worker_threads docs
The Event-Loop Blocking column lists no appropriate workload by design.
Thread-Pool Saturation Is a Separate Ceiling from Main-Thread Blocking
With a default of four threads, the libuv thread pool is where you will find all asynchronous tasks tied to the filesystem queued in line. The same goes for any dns.lookup() or pbkdf2 and scrypt calls, as well as zlib compression. Put enough sustained load on it and the queue is what creates the bottleneck; the resulting latency is purely local but can be mistaken for slowness further downstream.
dns.lookup() routes through the thread pool because it calls the operating system’s synchronous resolver. The dns.resolve() uses c-ares and bypasses the pool entirely. The two serve different purposes: dns.resolve() ignores /etc/hosts and the rest of the OS name resolution configuration.
There is an argument for upping UV_THREADPOOL_SIZE if the pool is truly being saturated. The cost is per-process memory. Moving crypto work to a worker thread is a common instinct, but since libuv’s pool is shared process-wide, asynchronous crypto calls from a worker still land in that same pool. Real isolation comes from moving synchronous CPU work.
Production Signals That Distinguish Event Loop Pressure from Other Latency Sources
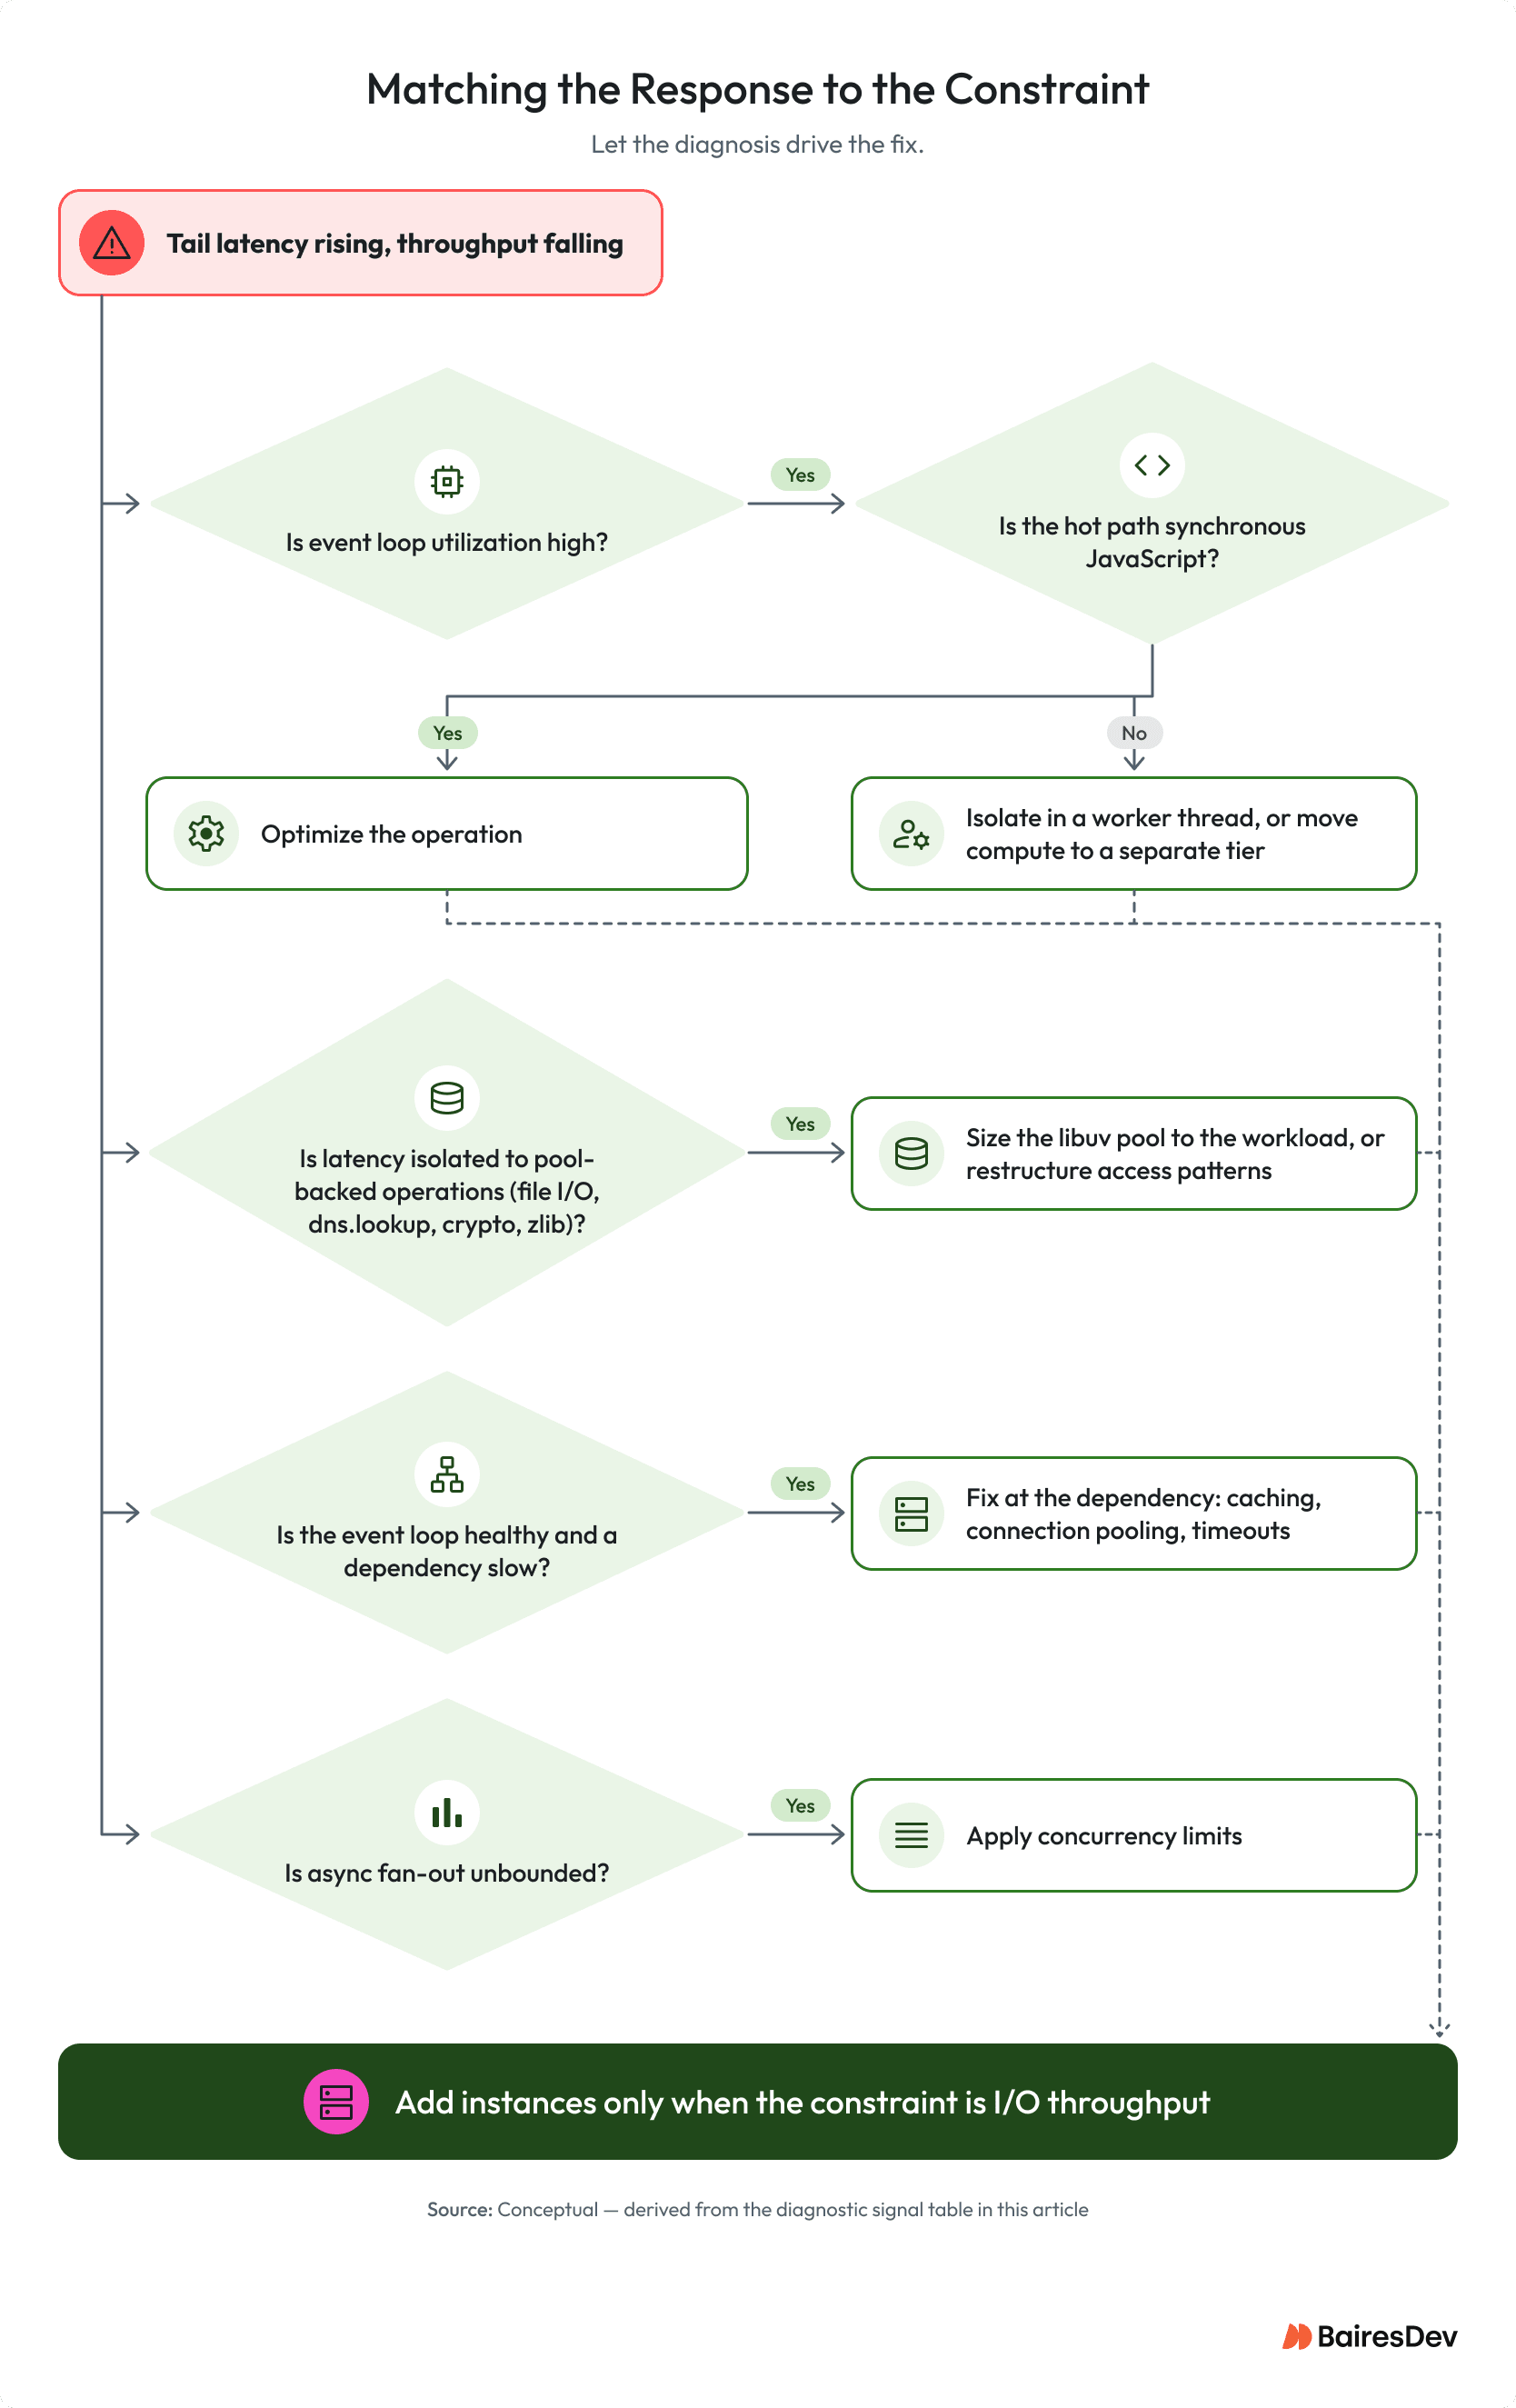
Four failure modes produce the same external symptom: rising latency, falling throughput. The challenge is in distinguishing one from the other to decide if you’re looking at a code or config change, or a bigger fleet.
Event loop lag measures the gap between when a callback is scheduled and when it actually executes. In ordinary circumstances this is a matter of microseconds, but when the main thread is contended it can run into the milliseconds, mirroring p99 latency.
The performance.eventLoopUtilization() API returns the ratio of active time to total time on the main thread. It’s available in every currently supported Node.js version.
Datadog exposes event loop delay and utilization at multiple percentiles. New Relic offers comparable coverage.
Table: Diagnostic Signals by Failure Mode
| Failure Mode | Primary Signal | Secondary Confirmation | First Response |
| Main-Thread Blocking | Event loop lag spikes on request arrival bursts | CPU % high on single core; other requests queue | Profile main thread; identify synchronous hot path |
| Thread-Pool Saturation | Latency rises specifically on pool-backed operations: file I/O, dns.lookup(), crypto, zlib | Event loop utilization stays flat; downstream services report normal response times | Size the pool to the workload, or move the work off it |
| Downstream I/O Latency | Event loop lag stable; latency on specific call types | Distributed tracing shows latency at the external service | Address at the dependency: caching, connection pooling, timeout tuning |
| Uncontrolled Concurrency | Memory growth; error rate rise; throughput ceiling lower than expected | Large fan-out of simultaneous async operations | Introduce concurrency limits (semaphore pattern, bounded queues) |
Sources: Node.js Performance APIs, Don’t Block the Event Loop, Datadog Node.js Integration
Node ships with event loop lag and utilization natively, making them straightforward to instrument. Thread-pool saturation is not so straightforward to pin down. It usually means correlating latency against the timing of pool-backed operations, and on a dashboard the curves the two produce look nearly identical. Make the wrong choice and you burn a diagnostic cycle while the constraint remains unaddressed.
When to Offload, Optimize, or Scale Out
There are three ways to go about it: you can optimize the hot path, offload CPU-bound tasks to a worker thread, or shift the service boundary.
The model is at its best with I/O-bound services. HTTP API proxies, WebSocket servers, real-time event streams, and read-heavy microservices all spend most of their main-thread time waiting on callbacks. Concurrency scales with connection count.
CPU-bound work that belongs in Node.js should be isolated in worker threads, well away from the asynchronous code handling I/O on the main thread. That applies to image processing, cryptography, and heavy data transformations. Creation overhead is high enough that the official documentation recommends pooling, and libraries like Piscina amortize that cost. Taking measurements first to confirm throughput justifies the architecture is the right approach before committing to worker threads for a given workload.
Then there is the matter of some CPU-bound workloads that have no place in Node.js. For computation-heavy services, a language with native parallelism or a dedicated processing tier is the more appropriate answer.
Uber has made the case for both. Its trip execution engine was written in Node.js for good reason; the asynchronous nature of the design and the ability to hold many concurrent connections in a single process suited the job.
The company also rewrote its push platform in Java and Netty. Membership convergence was being held up by event loop lag in the Node.js workers, leading to nodes that could not agree on the topology and lost messages. The rebuild swapped the gossip-based membership layer for a ZooKeeper-backed control plane at the same time, so the runtime was not the only variable that moved.
Both decisions date from the mid-to-late 2010s, and the specifics have aged. The pattern hasn’t. Each time, the answer tracked the workload.
Why Scaling Alone Can Mask a Per-Process Bottleneck
Putting in more processes does give you capacity. With the cluster module on Node, load spreads across cores and an I/O-heavy service gains greater headroom for connections with additional instances.
Scale-out leaves the per-operation cost unchanged. If a synchronous call has the thread tied up for 100ms, it runs for 100ms on the second replica and the tenth one as well.
You can see the cost of that distinction on the invoice. A common misdiagnosis: throughput recovers after a scale-out, the incident closes, and the blocking path stays in the codebase, now replicated across a fleet the company pays for month after month. Autoscaling triggers on the same traffic shape, ratcheting up the number of replicas until the request mix changes and utilization exceeds what the new capacity can handle.
The way to tell is to look at event loop utilization on each instance post scale-out. High numbers indicate the extra capacity is absorbing volume without resolving the constraint, and latency returns at a higher instance count and a higher bill.
Frequently Asked Questions
Why Does My Node.js Service Slow Down Under Load Even When CPU and Memory Look Fine?
The bottleneck sits inside the process, not the infrastructure. A blocked main thread or a saturated libuv thread pool still reports normal CPU and memory, so the dashboard looks healthy until latency spikes.
Catch it with application-level signals: event loop utilization, plus the timing of thread-pool-backed operations.
How Does Event-Loop Blocking Affect p95 and p99 Latency?
A blocking operation holds the thread for its full duration, and every callback that becomes runnable in that window queues behind it. That queueing pushes tail latency well past the operation’s own cost.
The effect tracks event loop utilization, not simple concurrency. A 50ms synchronous call that fires once per hundred requests stays invisible at p50 and dominates p99.
When Should Teams Use Worker Threads vs. Spawning Child Processes?
Worker threads share memory through SharedArrayBuffer and run in the same process, keeping overhead low for repeated CPU-bound tasks. Child processes give full isolation: crashes stay contained and they can run non-Node.js code.
Reach for worker threads for sustained, CPU-bound JavaScript work that needs shared memory. Pick child processes when you need crash containment or a different runtime.
Can Horizontal Scaling Fix Event Loop Blocking?
No. Scaling out adds processes and spreads requests across cores, which raises capacity, but the blocking operation still takes exactly as long inside whichever process handles it.
Extra replicas absorb volume. Optimizing the hot path or isolating the work in a worker thread changes the per-request cost.
What Is UV_THREADPOOL_SIZE and When Should Engineering Teams Change It?
UV_THREADPOOL_SIZE sets the size of libuv’s thread pool, defaulting to 4 with a ceiling of 1,024. Four threads cover most services running file I/O, dns.lookup(), or crypto work.
Raise it when p95/p99 latency climbs while CPU stays low and the thread pool is the diagnosed bottleneck. Push it higher than the workload needs, and memory overhead grows for nothing.
Izcóatl is a technology leader with 30+ years of experience architecting software solutions and scaling global engineering teams. He architected Sky's AI-driven media platforms and developed blockchain gaming features at Yuga Labs. At BairesDev, he serves as AI/ML Circle Leader, driving internal research and development communities.