



Engineering leaders don’t need another metric to memorize. They need a shared language for judging delivery speed and stability, and clear guardrails for reading the numbers correctly.
Key Points
- DORA measures delivery performance. It doesn’t track code quality or individual productivity.
- Definitions and measurement boundaries matter more than dashboard fixes.
- Read the five metrics together. One strong number can hide a problem elsewhere.
- Benchmark tiers are rough ranges, not universal targets, and the gap between elite and lagging teams remains wide in 2025.
If you’ve researched DORA metrics, you’ve probably noticed that the five-metric framework tells only part of the story once you connect it to the day-to-day delivery data in tools such as GitHub Actions. It’s a genuinely useful framework, but it gets tricky to apply once you’re deciding what counts as a deployment in a multi-service world, or what counts as a production failure.
This guide treats DORA metrics as a compact, outcome-based language for delivery speed and stability, with a judgment layer that makes the numbers easier to manage day to day. You’ll see DORA metrics explained in a way that maps to your actual architecture, along with how to use benchmark tiers without over-trusting them.
What Are DORA Metrics?
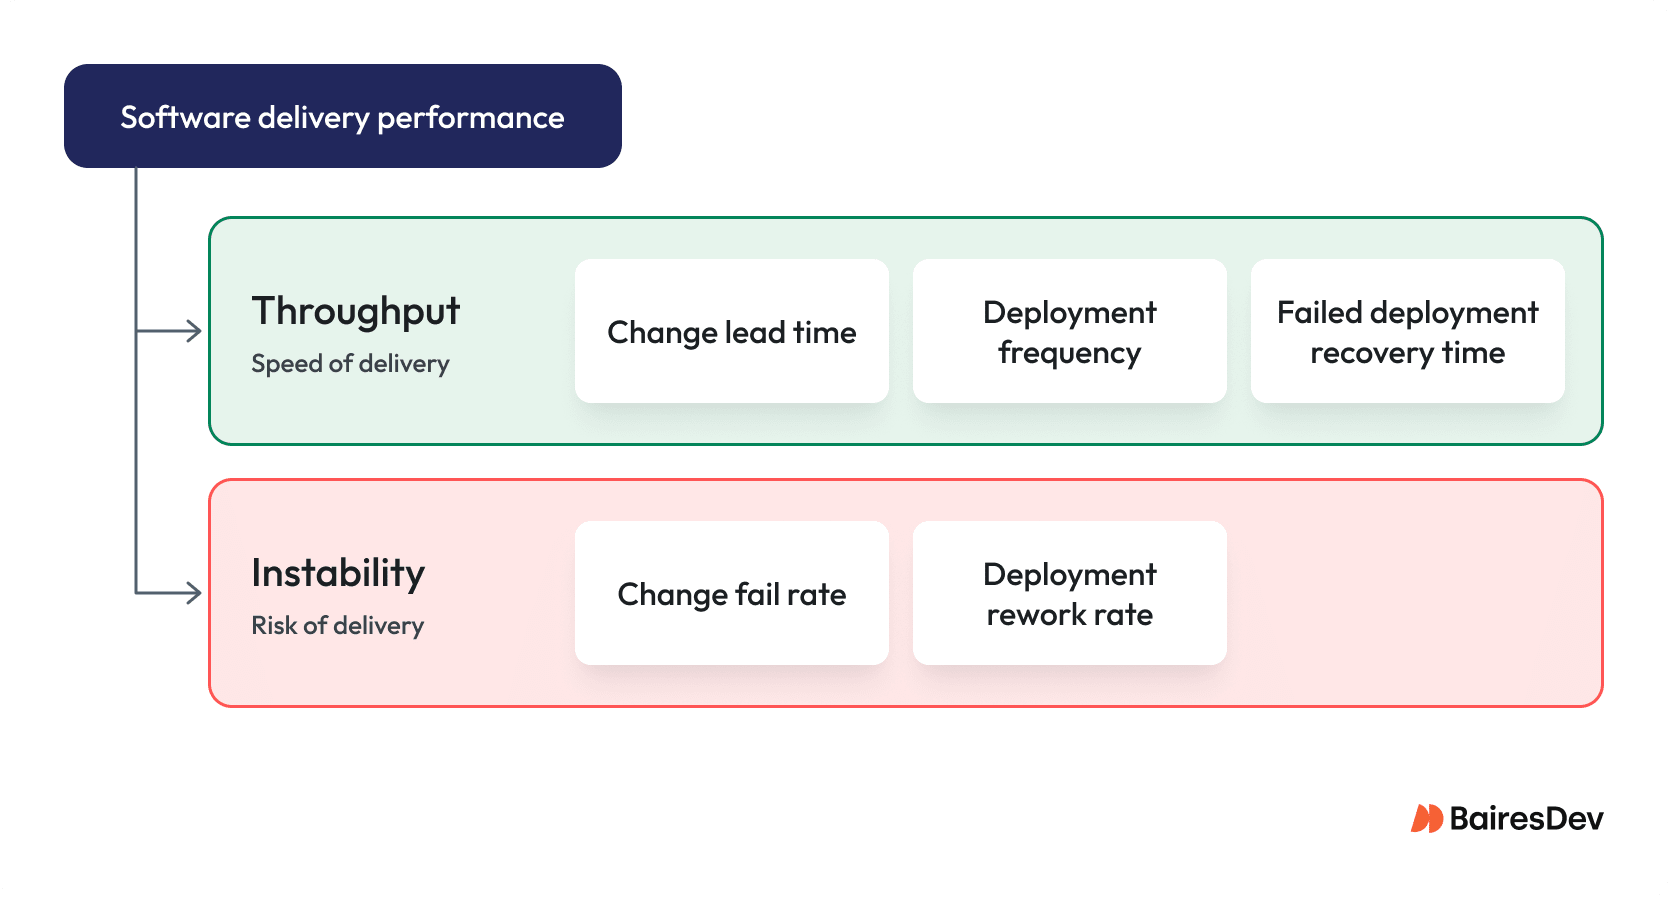
DORA metrics are outcome-oriented measures of software delivery performance. The current framework uses five measures across two factors: software delivery throughput and software delivery instability. Throughput covers change lead time, deployment frequency, and failed deployment recovery time. Instability covers change fail rate and deployment rework rate.
DORA stands for DevOps Research and Assessment. It’s the research program now operated by Google Cloud that developed these measures through years of research into software delivery and organizational performance. This guide uses speed and stability as shorthand for those two factors, since that’s the language most engineering leaders reach for day to day.
DORA doesn’t claim to measure code quality or individual engineer productivity. Think of DORA metrics as one set of key performance indicators among others, not a replacement for the rest. DORA isn’t a single score to aim for. Treating it as a score can funnel you into making lots of tiny, low-impact changes that each team measures differently.
DORA also can’t tell you whether you’re shipping the right product, whether faster delivery is reaching customers or revenue, or whether the pace is burning out your engineers and propping up reliability with unsustainable on-call effort. Track those separately. DORA is the delivery lens, not the whole picture.
Where DORA Benchmarks Come From
DORA metrics benchmarks look good in board decks, but they’re not a way to score you precisely against your peers. The classic “elite/high/medium/low” tiers come from DORA’s 2024 Accelerate State of DevOps report. They’re useful as industry benchmarks and a gut check, not a scorecard.
DORA’s definitions have kept evolving. The older “time to restore service” framing was renamed failed deployment recovery time, with the definition narrowed to recovery from failures caused by changes to production. In 2024, DORA added deployment rework rate as a fifth metric.
So where do the original four DORA metrics actually land today? A 2025 analysis of DORA’s survey data, covering nearly 5,000 technology professionals, shows a wide split between fast movers and everyone else:
| Metric | Top-performing share | Bottom-performing share |
| Deployment frequency | 16.2% deploy on demand, multiple times a day | 23.9% deploy less than once a month |
| Lead time for changes | 9.4% run under one hour | 43.5% need more than one week |
| Change fail rate | 8.5% sit in the 0-2% elite band | 39.5% run above 16% |
| Failed deployment recovery time | 21.3% recover in under an hour | 15.3% need more than one week |
DORA’s 2025 research also moves beyond the old four-tier ladder. The report analyzes software delivery performance alongside product performance, team performance, well-being, and other organizational factors rather than treating deployment speed as a standalone measure.
That distinction matters. A team can improve its delivery numbers while creating more operational friction or burning out the people responsible for sustaining the pace.
The Five DORA Metrics
Counting the wrong events can encourage you to improve your DORA profile while worsening production. Precision keeps GitHub green checks from masking customer pain. Adopt definitions that hold across microservices, monoliths, canary rollouts, and quarterly release trains.
Before you calculate anything, define three things:
- Measurement boundary: service, product, or value stream
- Source of truth: Argo CD, GitHub, PagerDuty, or another authoritative system
- Explicit exclusions: what won’t be counted
Deployment Frequency
Measures how often application changes are deployed to production or released to end users over a given period. DORA’s Quick Check ranges from less than once every six months to on-demand deployment multiple times per day.
In microservices, per-service measurement often works best because one chatty service can drown out the rest. Choose the boundary that matches ownership and customer value.
The payoff of higher frequency is smaller batches and lower blast radius, but only if you’re counting real releases. In some systems, deployment is the release event. In others, a feature flag activation may be what actually exposes the change to users. Document the convention and apply it consistently.
Change Lead Time
This is the time from when a change is committed to a version control system to when it’s successfully running in production. Some teams measure from merge because the data reconciles more easily. That works, but it hides code review and pre-merge queue time, so label the variation. DORA’s Quick Check defines the measure from code committed to code successfully running in production.
Don’t measure from “ticket created” or “PR opened” unless you want a planning metric. Long lead times can expose queues caused by environment contention, manual reviews, release approvals, and other handoffs.
Change Fail Rate
The percentage of changes to production or releases to users that result in degraded service and subsequently require remediation.
Remediation can include a hotfix, rollback, fix forward, or patch. It’s not “failed builds,” and it’s not “deployment job failed.” A platform team can show 98% green pipelines while two external squads repeatedly ship changes that trigger Sev-2 incidents. DORA cares about the latter.
Failed Deployment Recovery Time
Measures how long it takes to restore service after a production change causes degraded service and requires remediation. Historically called time to restore service or MTTR, DORA renamed and redefined the metric to focus specifically on failures caused by changes.
Start the clock with the relevant production impairment and stop it when service is restored. If you can’t reliably detect customer impact, use incident declaration as the start and document the limitation. This metric is your resilience reality check, especially during handoffs across ownership boundaries.
Deployment Rework Rate
Measures the percentage of deployments that are unplanned but happen as a result of an incident in production. DORA added it in 2024 as the fifth metric in its current framework.
This metric exposes something change fail rate can miss: how much deployment capacity is being consumed by corrective work. A team can have a tolerable change fail rate while still spending substantial capacity on bug-driven deployments. Looking at both helps engineering leaders distinguish isolated failures from a persistent stream of unplanned work.
Defining Ranges
DORA’s “elite/high/medium/low” tiers are clusters observed in survey responses, useful as industry benchmarks for a gut check, not universal targets. The ranges below come from the 2024 Accelerate State of DevOps report. Because they’re survey clusters, they don’t form a clean ladder on every metric. Use the bands to place yourself, then track your trend against your own baseline.
| Metric | What it measures | Elite | High | Medium | Low |
| Deployment frequency | How often you deploy to production for the chosen boundary | On demand | Daily to weekly | Weekly to monthly | Monthly to biannually |
| Lead time for changes | Time from commit to running in production | Under a day | One day to one week | One week to one month | One to six months |
| Change fail rate | % of deployments causing production-impacting failure requiring remediation | About 5% | About 20% | About 10% | About 40% |
| Failed deployment recovery time | Time to restore service after a bad deploy causes customer impact | Under an hour | Under a day | Under a day | One week to one month |
The tiers are derived from clustered survey responses, so consider whether you’re moving into a better band consistently and can explain the drivers. For instance, if you’re running quarterly release trains, your deployment frequency will look “low” by construction even if you’re doing disciplined engineering. What matters is whether that release model increases risk exposure through bigger batches and longer time to fix, and whether you’re choosing it intentionally.
Use the tiers to sanity-check:
- Expect tradeoffs to show up first in stability. Your deployment frequency may rise along with change fail rate.
- Look for alignment across speed metrics. “On-demand” deploys with a multi-week lead time usually mean you’re measuring different boundaries or you’ve got a hidden queue.
- Treat the boundary as part of the result. A product rollup can hide a service that recovers in minutes while another takes days.
- Use tiers for due diligence. When you evaluate external capacity, ask what definitions produce the numbers and whether the team can reproduce them from deploy and incident data.
Speed vs. Stability
Faster Doesn’t Automatically Mean Better
It’s tempting to view deployment frequency and lead time as “how fast you ship,” then see change fail rate and recovery time as “how safe you are.” In reality, they’re coupled. If you push the speed pair up without changing how you validate and roll back, you often just move failure downstream. You’ll ship more, but you’ll also create more production-impacting events.
DORA’s research reinforces the point. Its 2025 research found that higher AI adoption is associated with increases in both software delivery throughput and software delivery instability. DORA describes AI as an amplifier: it can magnify strong engineering systems, but it can also magnify weaknesses in testing, tooling, workflows, and infrastructure.
When Throughput Outruns Stability
For instance, you add two new delivery squads and ask them to ship smaller PRs daily. Deployment frequency improves and lead time drops, but change fail rate ticks up because integration gaps appear in production. The development process responds by slowing you back down.
The same pattern can emerge when teams automate code creation without strengthening verification. Faster code generation doesn’t automatically mean faster software delivery if the additional output creates more review, testing, integration, or remediation work.
What to Check When the Numbers Move
When the speed numbers improve, ask what actually changed:
- Batch size and verification improving, or risk-taking frequency increasing?
- Incident resolution faster, or recovery time obscured by unclear start and end timestamps?
- Flow improving, or quality gates relaxed with a later remediation tax?
Strong DevOps practices should improve delivery flow without increasing on-call load, but only when reliability and automation scale along with the team.
Reading Patterns to Find Bottlenecks
Start With the Pattern
DORA is most useful when you read it as a panel of instruments rather than five independent KPIs. Issues show up as a mismatch between throughput and instability, or between the individual throughput metrics. Celebrating one green number, such as “we deploy on-demand now,” can misdirect investment and scale a delivery model that increases operational load.
Trace the Number Back to the System
Start by looking for a dominant pattern. Then tie it back to evidence in ServiceNow, GitHub Actions, Argo CD, and PagerDuty.
For example, if deployment frequency is high but lead time for changes stays long, don’t blame your engineers. What you’re seeing is a gated flow. Changes merge, then sit in an approval queue, wait for an environment, or get trapped behind a release train.
Conversely, if lead time drops and deployment frequency rises but change fail rate climbs, you likely sped up risk-taking without keeping verification and rollback capacity in step. Your real bottleneck has moved into testing, canarying, or operational readiness.
Use Metric Pairs to Find the Constraint
For a quick leadership-grade diagnostic move, pick one problematic pairing and ask for the GitHub PR or ServiceNow change ticket that proves it. If change fail rate is low but failed deployment recovery time is long, insist on a few recent PagerDuty incident timelines. If recovery is fast but change fail rate is high, you’re paying a steady tax in rollbacks and hotfixes.
The table summarizes the most useful patterns:
| Pattern | Likely constraint | Evidence to inspect |
| High deployment frequency + long lead time | Queued or gated delivery | Merge-to-deploy timestamps, approval waits |
| Low change fail rate + long recovery | Weak detection or incident ownership | Incident timelines, handoffs, runbooks |
| High change fail rate + fast recovery | Standing rollback and hotfix tax | Rollback frequency, escaped defects |
| Rising frequency + rising change fail rate | Verification not scaling with software delivery throughput | Test coverage, canary performance, rollback readiness |
It’s easier for engineering leaders to act on change fail rate and recovery time trends when you use clear incident classification and severity definitions. Start by separating severity from priority so every team counts the same events.
How to Measure DORA
Define the Measurement Boundary
You can’t compare DORA across engineering teams if you let each group pick its own service boundary, deploy unit, and system of record. The easiest way to boost DORA on paper is to redefine the deploy unit or reclassify failures.
Write a one-page measurement contract instead. If your organization already uses value stream management tooling, borrow its boundary definitions rather than inventing new ones.
Establish the Source of Truth
Choose the authoritative systems that provide each measurement. GitHub or another version control system can establish commit timestamps. Argo CD or another deployment platform can establish production deployment events. PagerDuty or another incident management tool can establish service-impacting incidents and recovery.
The goal isn’t to create another dashboard. It’s to make sure the same event produces the same number regardless of which engineering team is reporting it.
Document What Doesn’t Count
If one organization counts a canary rollout to 5% as a deployment and another only counts a full rollout, their deployment frequency and change fail rate won’t describe the same risk. Document exclusions such as internal tooling deployments, test environments, or other events that fall outside the measurement boundary.
If the numbers don’t reconcile to deployment events and incident timelines, you don’t have a reliable way to track delivery performance.
Automated regression testing, progressive delivery, rollback readiness, and solid quality assurance practices can reduce deployment-related failures without adding large release gates. Improving verification and validation is where that work usually starts.
Using DORA for Scaling and Vendor Diligence
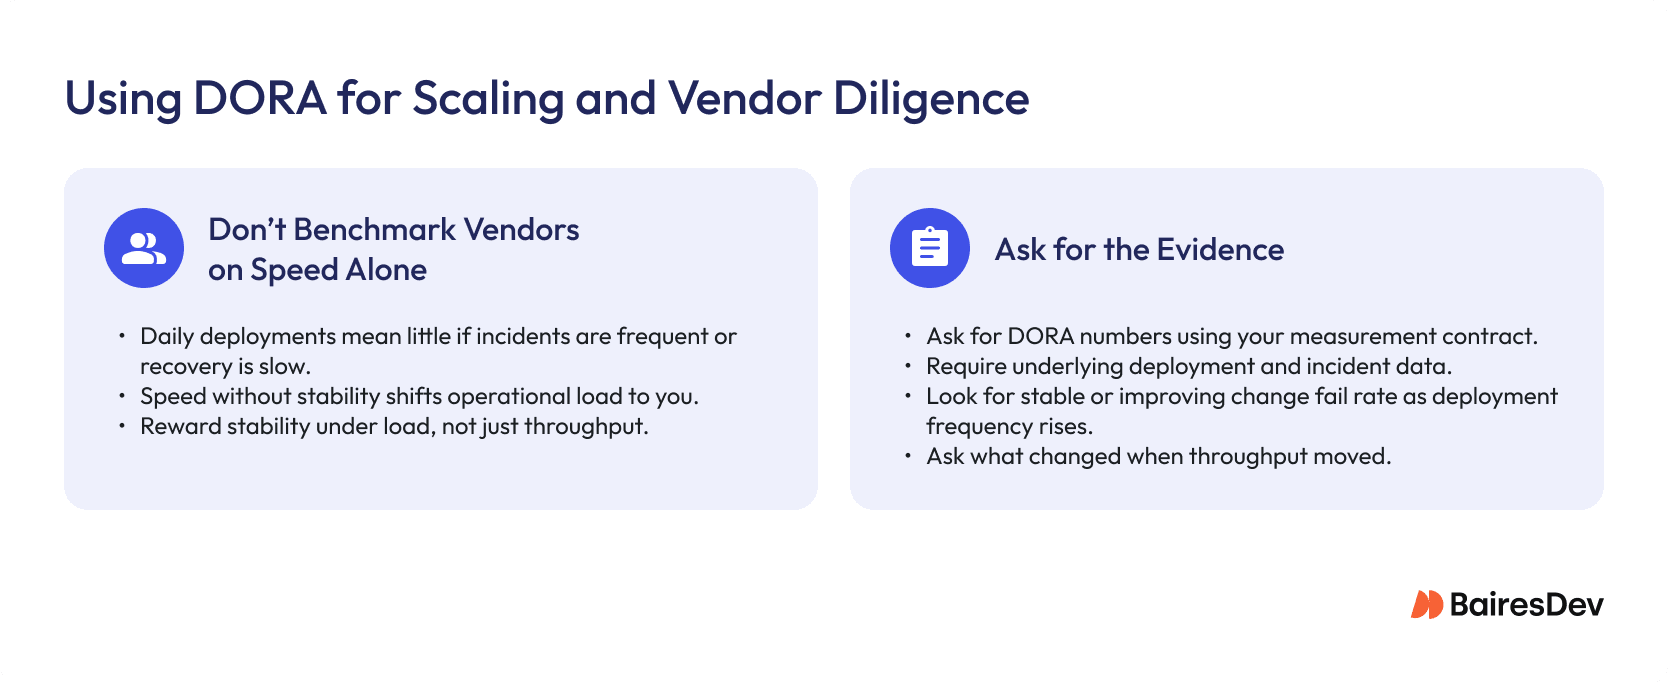
Don’t Benchmark Vendors on Speed Alone
A vendor’s slide promises daily deployments and shows a tidy lead-time chart. But in a few months, your platform team is left cleaning up their mess. Use standardized diligence to evaluate a platform program, acquisition target, internal reorganization, or external engineering partner.
When you’re adding headcount or evaluating a nearshore partner, use DORA less as a benchmark and more as a story about risk. Require the partner to produce their DORA numbers from your definitions, then ask what changed when throughput moved. Did change fail rate or recovery time worsen?
Don’t let “we deploy daily” sell you on capacity. A team can inflate deployment frequency with low-impact changes while pushing incident ownership onto your platform group. Reward stability under load, not just speed.
Ask for the Evidence
The strongest diligence question isn’t “What’s your deployment frequency?” It’s “Show me how you calculated it.”
Require the partner to use your measurement contract, produce the underlying deployment and incident data, and explain any boundary or classification differences. A team that can reproduce its numbers from operational evidence is giving you something more useful than a polished benchmark slide.
DORA itself recommends using software delivery performance metrics alongside other measures rather than treating them as the complete picture of engineering performance.
Delivery Metrics That Actually Change How You Lead
Implementing DORA metrics works best when leaders use them to expose constraints instead of as a way to grade teams. Set consistent boundaries and definitions, keep throughput and instability in view together, and require every headline number to reconcile with deployment and incident evidence.
That discipline matters just as much when you’re adding outside capacity. Additional engineering capacity should improve delivery flow without shifting more incident load onto your internal platform team, so hold any augmentation or outsourcing partner to the same measurement contract you use internally.
The goal isn’t simply to deploy more often. It’s a software delivery process that gets faster without getting harder to operate.