

Key Points
- Run Performance Recording before making any changes. The Events view shows exactly which layer is responsible, not which layer feels like the problem.
- Tableau bottlenecks fall into three layers: workbook design, data source, and server capacity. Each has a different owner and a different fix.
- Most teams waste time on workbook tweaks when “Executing Query” events in Performance Recording already point to a data layer problem.
- “Show Only Relevant Values” across multiple filters multiplies query load per interaction and is one of the most common culprits.
Your Tableau dashboard is performing slowly. This is usually a UX and decision-making problem, not just a technical one, but everyone seems to have their own take on the reason. As a result, the first solutions your team attempts are likely to focus on the incorrect layer.
Diagnosing Tableau Performance Issues
Teams tend to jump straight into making changes without first asking themselves, “How do we make this dashboard faster?” That’s the opposite of what should be done. The key question to ask is, “Where is the time actually going?”
Tableau performance problems can be categorized into three layers, each exhibiting unique symptoms, requiring different tools, and having different responsible parties. Mixing them up could mean wasting weeks tweaking formulas when the real issue is just an unindexed column in your data source.
There are three layers to consider: workbook design, data source performance, and Tableau Server capacity.
According to Tableau’s official documentation, the basic truth is this: whenever your data source is running slow, Tableau Desktop will be slow too. When Tableau Desktop runs slowly, you can pretty much count on Tableau Server being slow too, and that’s the diagnostic framework you should use to troubleshoot the problem.
I collaborated with a team for two weeks to rebuild their calculated fields and simplify the dashboard design in an effort to resolve a report that took 40 seconds to load. Once we actually got Performance Recording going, we found that the “Executing Query” event was eating up 35 out of the 40 seconds. The issue was a join column in their database that hadn’t been indexed. It only took five minutes of work to put that one index in place. The page now loads in just six seconds. Two weeks spent working on the incorrect layer. The performance recorder could have shown them exactly where to focus their attention right from the beginning.
Make sure you enable Performance Recording in Tableau Desktop before you start working on anything. It precisely identifies how time is allocated: linking to the data source, compiling queries, executing them, computing layouts, and rendering. The biggest outlier tells you which layer to check out. Here’s a straightforward way to actually pinpoint bottlenecks rather than just making assumptions.
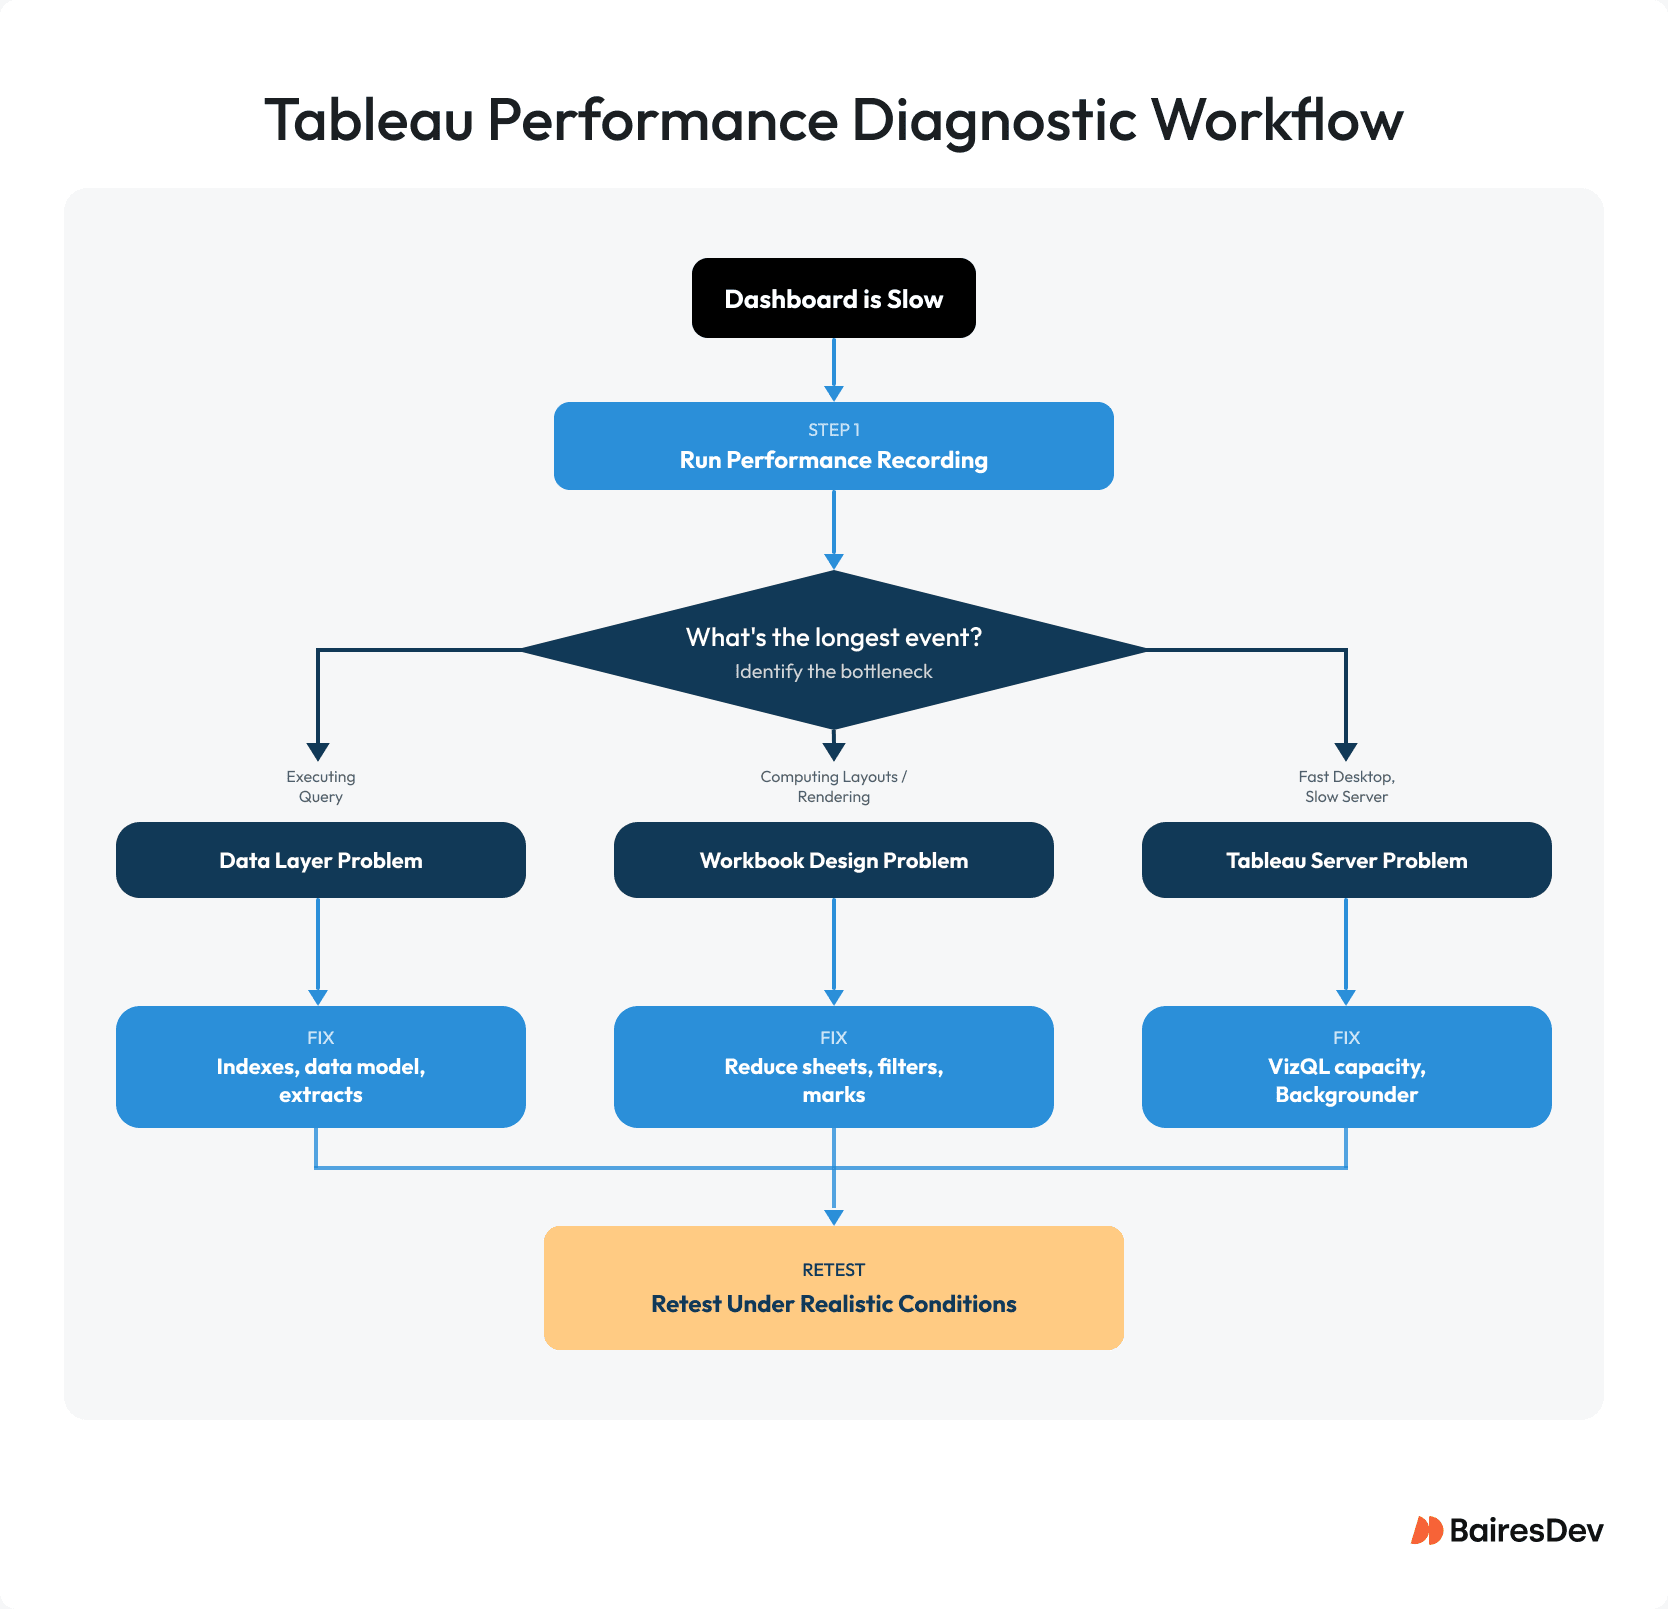
If a Tableau dashboard loads slowly, here’s the diagnostic sequence:
- Figure out which workbook or view is running slowly.
- Use Run Performance Recording to identify where time is being utilized.
- Check the Events view to see if the longest event is query execution, layout computation, or server rendering.
- If you’re dealing with slow query execution, the issue typically stems from your data layer, e.g., indexing problems, how your data model is structured, or whether you’re pulling from extracted data versus live sources.
- If the issue lies in the workbook handling, whether it’s sheets, filters, parameters like marks, or the actual calculations itself, during the layout or rendering phase.
- Tackle the biggest bottleneck first, then check the results again under real-world conditions.
Workbook Performance Optimization
The most common and easily fixable issues tend to be related to workbook-level performance. This is the place where the developer or report author can directly influence what affects how well things run, and it’s your first stop to investigate once you’ve already checked that the data layer isn’t the problem.
Each visualization on a dashboard executes its own queries and creates its own marks. A dashboard using ten worksheets sends way more queries than one with only four worksheets. Tableau suggests that you should target having 3-5 key visualizations per dashboard. If your analysis has more than five components, split it into separate Tableau dashboards to keep load times fast. You’re not going to find many team members who can actually work with ten charts simultaneously, as the cognitive load becomes a bottleneck long before performance does.
Next, let’s scrutinize filters. Every time you see a filter, it runs at least one query to load its options. Using “Show Only Relevant Values” across several filters is a major anti-pattern in Tableau. Changing just one filter can trigger four or five extra queries to run at the same time, since each filter has to recalculate what values it can display. For fields with a lot of unique entries, like customer IDs or email addresses, use Wildcard Match filters so users can search by typing instead of displaying the entire list of values. You should use parameters instead of quick filters when the user needs a simple selector. Parameters don’t trigger extra queries to load, which can significantly enhance report speed on dashboards that have several filter controls.
Calculations aren’t all created equal, and some hurt performance a lot more than others. In most cases, won’t see any performance hit when you use the built-in features like groups, sets, and bins. Basic aggregations happen directly in the data source, making them quick, while LOD expressions create nested SELECT statements and rely completely on how well your data source performs. In Tableau, table calculations execute on the data that’s already been returned as your result set. When the data source is the bottleneck and the result sets are small, they can actually perform better than LOD expressions. Keep an eye out for ineffective calculations: depending on source optimization and cardinality, COUNTD can be among the slowest types of aggregation. Typically, CASE works better than nested IF/ELSEIF. Also, if you convert strings and dates, it’ll slow things down, so try to work with numeric data types whenever you can. Performing calculations at the row level really adds up in cost when dealing with huge datasets.
Mark density is the invisible threat. Tableau doesn’t enforce a hard limit on marks per view, so teams frequently don’t catch this issue until load times become unacceptable. Complex polygons always get processed on the server no matter how things are set up. If your report is taking a long time to load and you’re unsure of the reason, start by checking the mark count. Use dashboards with set widths instead of letting them resize automatically so they don’t reload every time the browser window changes size.
Finally, you also need to consider perceived performance. Improving interaction flow, progressive disclosure, or prioritizing above-the-fold insights can improve UX even before raw load time is fully optimized. Failing to do so can make even performance dashboards feel sluggish, even if there’s nothing wrong on the technical side.
Before you do anything else, make sure to run the Workbook Optimizer if you’re using Tableau 2022.1 or any newer version. It automatically reviews about 25 best practices for optimizing Tableau performance, including unused fields, filter settings, dashboard design, calculation patterns, and data source configuration. It won’t catch everything, but it’ll spot the easy problems quicker than you can.
Data Source Performance
If Performance Recording indicates that most of the time is spent in “Executing Query” events, then the issue isn’t with Tableau. This is your data layer. That’s when people blame Tableau for being slow due to messy databases or bad data layouts. Understanding the difference between a developer fix and a platform fix is important for deciding who is responsible for resolving the issue. You must develop a coherent ownership model that’s aligned with how your product is maintained, so that developers, analytics engineers, platform teams, and Product and Design always know who owns what.
The extract-vs-live question comes first. Tableau extracts are the fastest way to improve most workbook performance. They transfer the data into Tableau’s Hyper engine, a tool that’s specifically designed to handle analytical queries efficiently. But extracts aren’t a one-size-fits-all solution. For datasets with millions of rows, refreshing data can start to feel sluggish in real-world use, think roughly a million records per minute. For large datasets that need real-time data, having a well-optimized live connection to a quick data source like Snowflake, Redshift, or BigQuery is the ideal option. One format note: .tde extracts are being phased out. The final version of Tableau that still supported .tde was 2024.2. So, the .hyper format is the standard. If you’re still working with .tde files, it’s time to convert them.
Try to use incremental extract refreshes whenever you can. They add new rows instead of recreating the entire extract, making it way faster. Since incremental refreshes can’t manage updated existing rows, you’ll need full refreshes for those situations.
When you use custom SQL, it turns off join culling, which is Tableau’s way of optimizing queries to only include the tables necessary for the current view. With custom SQL, every table gets queried every time, even if the current chart doesn’t need that data, and SELECT in custom SQL really drains resources. Instead, shift the complex logic to a database view. The data source can improve performance by optimizing it, storing it temporarily, and Tableau’s query generation still operates as expected. My team once dealt with a dashboard that took 45 seconds to load, and the whole problem came down to a custom SQL data source that had six complex joins and a SELECT . We shifted the logic to a database view. The page now loads in just six seconds. There are absolutely no changes to the dashboard. The workbook wasn’t actually what was causing the issue.
Try to use inner joins instead of outer joins whenever possible. If you’re using Tableau’s relationship model, make sure to set the cardinality and referential integrity right. Choosing “One” when the field values are unique lets Tableau improve the order of joins.
Make sure you create indexes for all the columns that show up in your Tableau filters, joins, and WHERE clauses. According to Tableau’s performance checklist, it’s recommended to “index database tables to improve filter efficiency,” and users have noted that with proper indexing, load times can drop from 20 seconds down to 5-8 seconds. When you apply context filters to 2-3 high-cardinality dimensions and they trim your dataset down by 40% or more, you can expect to see your filter speed improve by 50-80% going forward.
Whenever possible, gather data at the ETL layer. The aggregation strategy needs to be aligned with the primary user workflows or decision-making needs. Also, Tableau works best with data that’s already summarized, not raw transactional tables that need heavy aggregation. When you manage your data well at the ETL layer, your data visualization tools end up delivering better results for your business.
What About Tableau Server Performance?
So, if a workbook runs quickly in Tableau Desktop but drags when it’s live on Tableau Server, the bottleneck is most likely Tableau Server itself. This is something the platform team needs to handle, not a problem that developers can fix on their end. Ultimately, infrastructure performance will place a hard limit on user experience, e.g., no amount of small tweaks will help when responsiveness falls off a cliff during peak demand. That will have to be handled on the infra side.
The biggest slowdown in Tableau Server usually happens when VizQL processes max out their capacity. VizQL handles loading and rendering visualizations, computes queries, and manages sessions for every user who engages with a dashboard.
Adding VizQL processes roughly doubles concurrent user capacity, but adding too many causes resource contention. Put them in one by one and take a measurement. Tableau suggests using Linux for organizations that have more than 1,000 VizQL sessions every hour. Enterprise VizQL servers need a minimum of 64 GB of RAM, but most production setups use 128 GB.
Server-side rendering is something else that has a direct effect on how users experience your site. Tableau figures out a complexity score for each view. If the server’s response size doesn’t exceed its limits (100 KB for computers and 60 KB for phones), the user’s browser immediately starts loading the page. The VizQL server handles the rendering process above that point. To try out various thresholds, just add ?:render=80 to the end of any view URL. If the server is hogging too many resources, tweak the Tableau dashboards down instead of dumping more power into the server.
In situations where you’re dealing with a lot of extracts, the Backgrounder process is what takes care of refreshing those extracts, managing subscriptions, and running your scheduled flows. It runs just one task at a time, so you’ll need to spin up extra copies of it if you want several jobs going simultaneously, and you’ll also want to set your data pulls to off-peak times so real users don’t get slowed down. Jobs that have been pending for over 12 hours without available concurrency are completely removed from the queue.
When you’re running a large deployment, you should put Backgrounder on its own separate node away from VizQL so that the work your users see doesn’t get bogged down by background processing tasks.
| Bottleneck Layer | How to Identify | Who Fixes It |
| Workbook design | Slow in Desktop, Performance Recording shows layout/render time | Developer: reduce sheets, filters, marks, calculations |
| Data source | Performance Recording shows “Executing Query” as longest event | Developer + Platform: optimize SQL, add indexes, consider extracts |
| Tableau Server | Fast in Desktop, slow after publishing | Platform team: add VizQL capacity, tune configuration, schedule Backgrounder |
The Takeaway
For the most part, Tableau slowdowns aren’t caused by bad settings. They happen because users spot lags after the software is running, and more processing doesn’t fix it. That’s why performance must be viewed as a prerequisite for a positive product experience. When users struggle with sluggish performance or reliability, that is likely to impact trust and adoption. In other words, performance equates to dependability, as no analytics team can depend on dashboards that fail at the worst possible moment, e.g., under peak load.
Start optimizing by recording performance data, then move through each step in order, starting with your data source, moving to Tableau Desktop, and finishing with Tableau Server. Tackle the biggest problem first, and then run your tests again with real users to see if it worked.


