

Key Points
- GraphQL performance problems usually come from resolver logic, query shape, database access, caching gaps, or poor observability.
- The N+1 problem is one of the most common causes of slow GraphQL APIs, especially when nested fields trigger repeated database calls.
- Query complexity limits, pagination, batching, and caching help prevent expensive requests from overwhelming backend systems.
- Teams should trace resolvers, inspect database behavior, and test under production-like load before making architectural changes.
GraphQL isn’t the real culprit when your API feels sluggish. Too often, teams blame the tech instead of digging deeper. The real bottlenecks usually hide in the resolver logic, the database’s response time, or how the query itself is structured, not in GraphQL’s core design.
Diagnosing Performance Issues in GraphQL
Nine times out of ten, the bottleneck stems from one of four main issues: a query retrieving far more data than the application needs, resolvers unnecessarily querying the database hundreds of times, a complete lack of caching at any level, or the absence of observability tools that obscure where the time is truly being spent.
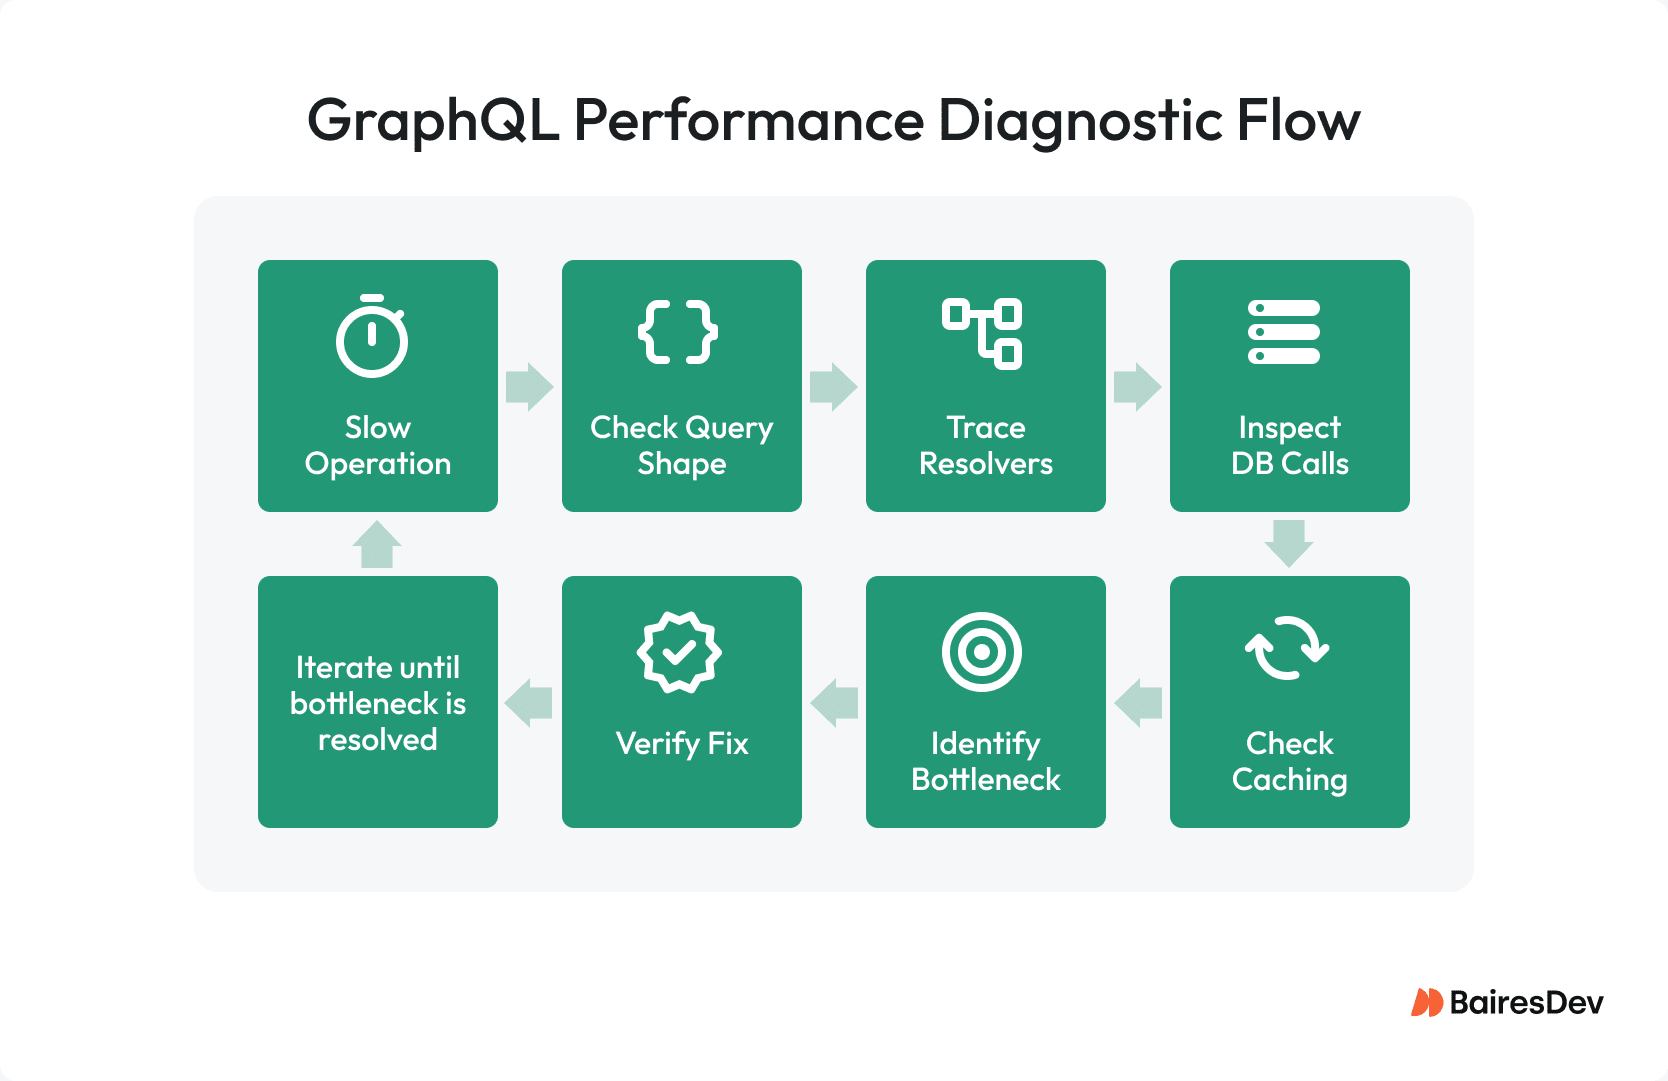
Figure out which operation is sluggish. Start by checking the query shape. Run a trace resolver. Trace what’s hitting the database. Inspect the caching behavior. Zero in on the real bottleneck your data is screaming about, and not the one your team blurted out in Slack. Verify the fix holds up under production-like traffic before you call it done. Testing on a dev database with 500 rows won’t cut it if you’re staring down 5 million.
One time, I partnered with a team facing a significant performance issue: their product listing page was taking 4 seconds to load via their GraphQL API. Convinced that GraphQL was inherently slow, they were seriously contemplating a switch back to REST. Implementing resolver-level tracing quickly revealed the problem’s source. We discovered that a single nested field, specifically, the reviews linked to each product, was firing off an astonishing 200 separate database queries to populate a mere 50-item list.
This was a classic N+1 issue. Once we introduced a data loader, the response time plummeted to 180 milliseconds. The debate about migrating away from GraphQL concluded that same afternoon.
The N+1 Problem and Resolver Design
If you’ve ever asked, “Why is my backend melting under a basic list load?” that’s likely the N+1 problem.
Here’s what happens: you load a list of, say, 50 products, and for each product your resolver fires off a separate database hit instead of pulling everything in one go. According to Apollo’s survey data, roughly one-third of teams hit this issue during builds, yet only about 13% actually use a data loader, the go-to fix. It’s a known pain point, but too many treat it like a minor annoyance instead of the full-blown fire drill it really is.
Facebook released DataLoader around 2010, where it started as part of their internal system for loading entities. It combines multiple .load(id) calls that happen in the same event loop cycle into one backend request, and it stores results so hitting the same key again doesn’t cost any extra.
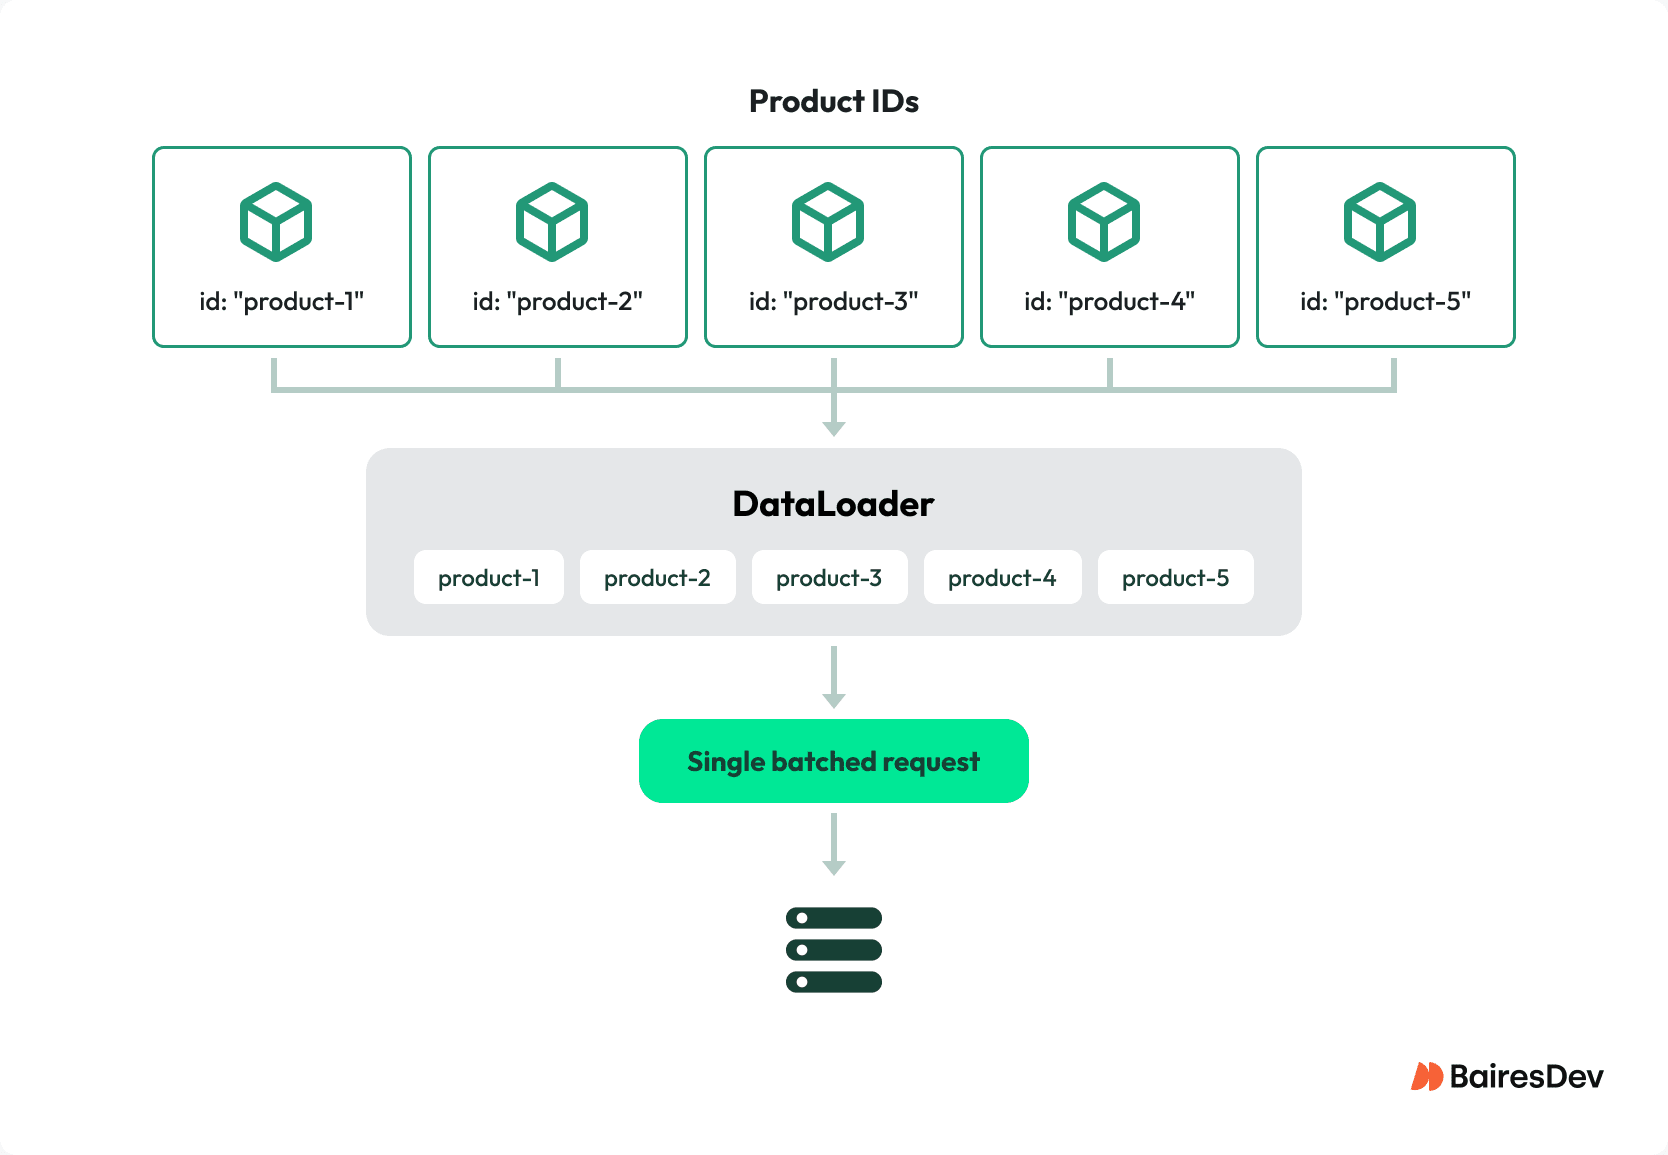
The caching doesn’t carry over between different requests because it’s intentionally designed that way, staying limited to just one operation at a time. A list featuring 50 products with reviews reduced its database calls from 51 down to just 2. I wouldn’t consider that an optimization. That’s an entirely separate system.
The areas where data loader patterns fail are crucial to watch closely. When batch functions interact with downstream services that have their own rate limits, they require size-aware chunking. You can’t simply send an unlimited batch to a rate-limited API and expect it to work.
Data loaders left hanging between requests (a real issue with serverless cold starts) end up serving outdated info, and the bugs that come from it are a nightmare to track down. In Apollo Federation, the router query planner groups entity requests to Query._entities at the federation level, managing the N+1 issue, but you’ll still need to implement your own data loader in your subgraph resolvers for fetching nested data within the subgraph. The federation layer isn’t a complete solution to all problems.
Past the N+1 point, some resolver patterns keep spinning their wheels doing redundant tasks. Retrieving whole objects even when just the IDs are required. A well-configured GraphQL server shouldn’t let resolvers run for nested fields the client didn’t ask for, yet eager loading still triggers them. You’ve got resolver waterfalls happening, where one resolver sits idle waiting on another before starting its own work.
When you use @requires directives in federated setups, you end up making sequential jumps across subgraphs, which is basically the waterfall problem but spread out across a distributed system, and you’re stuck paying network latency costs every single time you hop to the next subgraph. Every single hop makes the delay even longer.
Query Shape and Over-Fetching
GraphQL’s flexibility is a double-edged sword. Sure, clients can fetch deeply nested data in a single query, but without the right safeguards, those queries can easily tank your server’s performance.
Over-fetching in GraphQL isn’t the same as in REST. When you’re using REST, over-fetching happens because the endpoint gives you way more fields than you actually want — GitHub switched to GraphQL and cut their typical response down from 93.5 fields to just 5.5 by letting clients grab only the specific data they required.
In GraphQL, over-fetching occurs when the client asks for more data depth or breadth than what the server can efficiently provide. A single query asking for users along with their orders, the items within those orders, product information for each item, and reviews tied to each product can quickly trigger thousands of resolver calls from just one request. Just one request. Numerous invocations.
Use query complexity analysis to evaluate incoming queries, rejecting or throttling the costly ones before they run.
Here’s how Shopify’s production model works. Objects run you 1 point each, connections cost 2 points plus however many objects come back, and mutations will set you back 10 points. They enforce a 50-point-per-second rate limit with a 1,000-point burst allowance. Those figures show Shopify’s unique schema and traffic trends, your schema requires its own adjustments, or you risk either blocking valid API requests or overlooking costly patterns altogether. Go ahead and choose either of the two failure modes. Skipping calibration means you can’t escape either.
Depth limiting is the easier approach: you just set a maximum on how many levels deep a query is allowed to go. Neither method addresses the issue of slow resolvers. That’s not their intended purpose. They stop runaway queries from using up all your server resources during spikes in complex queries.
Server-side pagination is non-negotiable. A list field that lacks pagination is bound to cause a performance issue at some point; you just can’t predict when it will occur. Use cursor-based pagination following the Relay Connection Specification. Cursors apply WHERE clauses to indexed columns, so their speed stays the same no matter how far down the list the client scrolls. As your offset gets bigger with offset pagination, performance gets worse because the database has to scan through and throw away all those rows you’re skipping over. It’s performing the task and then discarding it. Stop using it.
Database and Downstream Performance
If resolver tracing reveals that most of your time is buried in database calls, the problem isn’t with your GraphQL layer. What’s really making it happen is what’s below the surface.
The biggest performance problems usually come down to two things: you haven’t created indexes on the columns you’re using to filter and join your data, and your resolvers are grabbing every single column with SELECT * when they actually only need two fields, which wastes bandwidth and memory on every single request. Utilize a tool like graphql-fields to examine the query AST and create specific SELECT statements that retrieve only the requested data. Making that single adjustment can really improve performance.
The diagnostic approach I always return to is this: turn on query logging in your database, execute the slow operation, and then examine what queries actually get sent to the database. Most GraphQL performance issues arise from the disconnect between “the team’s perception of the database’s actions” and “the database’s actual performance.” A resolver that appears efficient in your code might actually be causing the database to scan millions of rows with its SQL query. You won’t find out the answer unless you actually check for yourself.
Third-party APIs and microservices can assist with batching data loaders, but they won’t solve everything on their own. You still need server timeouts and circuit breakers to handle failures. If a downstream service drags its feet, GraphQL connections stay open until your server hits max concurrency—bad news for performance.
Shopify’s engineers found that switching from depth-first to breadth-first query execution slashed CPU usage by 15x and cut memory consumption by 90% for large list queries. Execution matters just as much as resolver design, often more.
Caching GraphQL Responses
Caching is where GraphQL really differs most sharply from REST, and it’s also where most teams tend to miss out on the biggest performance gains.
REST makes it clear and straightforward to use HTTP caching. One URL, one cache key, GET requests work out of the box, CDNs slot right in. GraphQL processes all requests through one endpoint using POST. Traditional HTTP caching doesn’t know what to do with that.
You’ll need to construct your caching strategy using multiple layers.
On the client side, caches that are normalized, such as Apollo Client’s InMemoryCache, eliminate duplicate entities based on their type and ID. That’s helpful because it stops unnecessary GraphQL calls whenever users switch pages. The actual problem you’ll face when running this isn’t really about removing duplicates. It’s about understanding when to invalidate after a mutation and recognizing when stale data is a real threat versus just a minor inconvenience. Most teams don’t really give that distinction much thought until something actually breaks in their production environment.
At the CDN level, persisted queries give you a workaround worth understanding. The query’s unique identifier is a SHA-256 hash, the server turns that hash into a GET request URL parameter, and now your reply can be stored in a CDN cache. Shopify saw a 91% drop in upstream traffic after they started using persisted queries. Persisted queries work as a security feature too — they prevent random queries from running against your schema by only allowing pre-approved ones.
Be clear about what persisted queries actually solve. That’s both a transmission issue and a security issue. It’s not a resolver problem. It’s not a database issue. If your resolvers are sluggish, persisted queries won’t help you out.
Apollo Server gives you the ability to use the @cacheControl directive on the server side, which allows you to specify TTLs right at the field level. The total cache TTL for the response is determined by the lowest value among all fields, with the root query fields set to a default of maxAge: 0. That means if you don’t specifically choose to cache a field, the whole response can’t be stored for later use. Just one oversight means the entire response bypasses cache. You need to be intentional.
Getting your cache ready in advance is a smart move, especially for cold paths. For distributed caching, Redis is the preferred choice. There are GraphQL CDNs specifically designed to reach cache hit rates exceeding 85% and reduce server load by over 60%. However, the effectiveness of these results largely depends on how well your schema is structured for caching.
Observability and Production Monitoring
GraphQL uses a single-entry point for all queries, unlike traditional APIs. If you’re putting GraphQL into production, you’ll need resolver-level tracing just to get the baseline of observability required to keep things running smoothly.
Apollo GraphOS offers detailed analytics at the field level, helping you identify slow resolvers, costly operations, and areas with high error rates. If your team isn’t using Apollo’s managed service, you can still monitor your GraphQL server by integrating OpenTelemetry. This allows you to track spans related to validation, query planning, execution, subgraph fetching, and response serialization. You can then connect these insights to Datadog, Grafana, or any other monitoring tools your team prefers. These resources simplify the process of identifying bottlenecks, saving you from the hassle of manual investigation.
Start with operation-level latency and see which GraphQL queries lag. Then move to resolver timing to catch the slow fields inside those queries, and finally inspect the downstream calls those resolvers trigger. Many teams focus only on operation-level monitoring and overlook that a single resolver accounts for 90% of the latency.
| Bottleneck | How to Identify | Fix |
| N+1 resolver pattern | Resolver tracing shows many identical DB calls | Add data loader for batching |
| Query too deep/complex | Complexity analysis flags high-cost queries | Depth limiting, complexity scoring, pagination |
| Slow database | DB query logs show full table scans or missing indexes | Add indexes, optimize queries, project only needed columns |
| No caching | Same data fetched repeatedly across requests | Client cache, CDN with persisted queries, server-side Redis |
| No observability | Can’t identify which resolver is slow | Add resolver-level tracing via Apollo GraphOS or OpenTelemetry |
Fix the Bottleneck, Not the Architecture
GraphQL performance problems are almost never a GraphQL problem. They’re resolver problems, database access problems, missing caching layers, and “we have no idea what’s actually happening in production” problems.
The teams that fix them fast aren’t smarter. They’re just more disciplined and they trace before they optimize. They batch before they cache. They measure under production-like load before declaring victory. That order matters, and skipping steps is why the same performance fires keep recurring.


