



Interest in AI has skyrocketed, especially in data analytics. Everyone wants to know the best strategy to leverage this new technology. Managers want to know the timeline for adoption. Data teams want to know which tools can make their jobs easier.
But it is hard to determine the best use case until it is understood what is meant by AI. Skipping this step can be costly. It can lead to creating pilot integrations which lead nowhere and create debugging nightmares for engineering teams.
Common Use Cases
There are three distinct use cases for integrating AI into a data analytics workflow: automation, augmentation, and prediction/optimization.
These are not interchangeable. Each approach has a different architecture, depends on different data, and has a different risk profile. Understanding how your needs map to each solution is the first step.
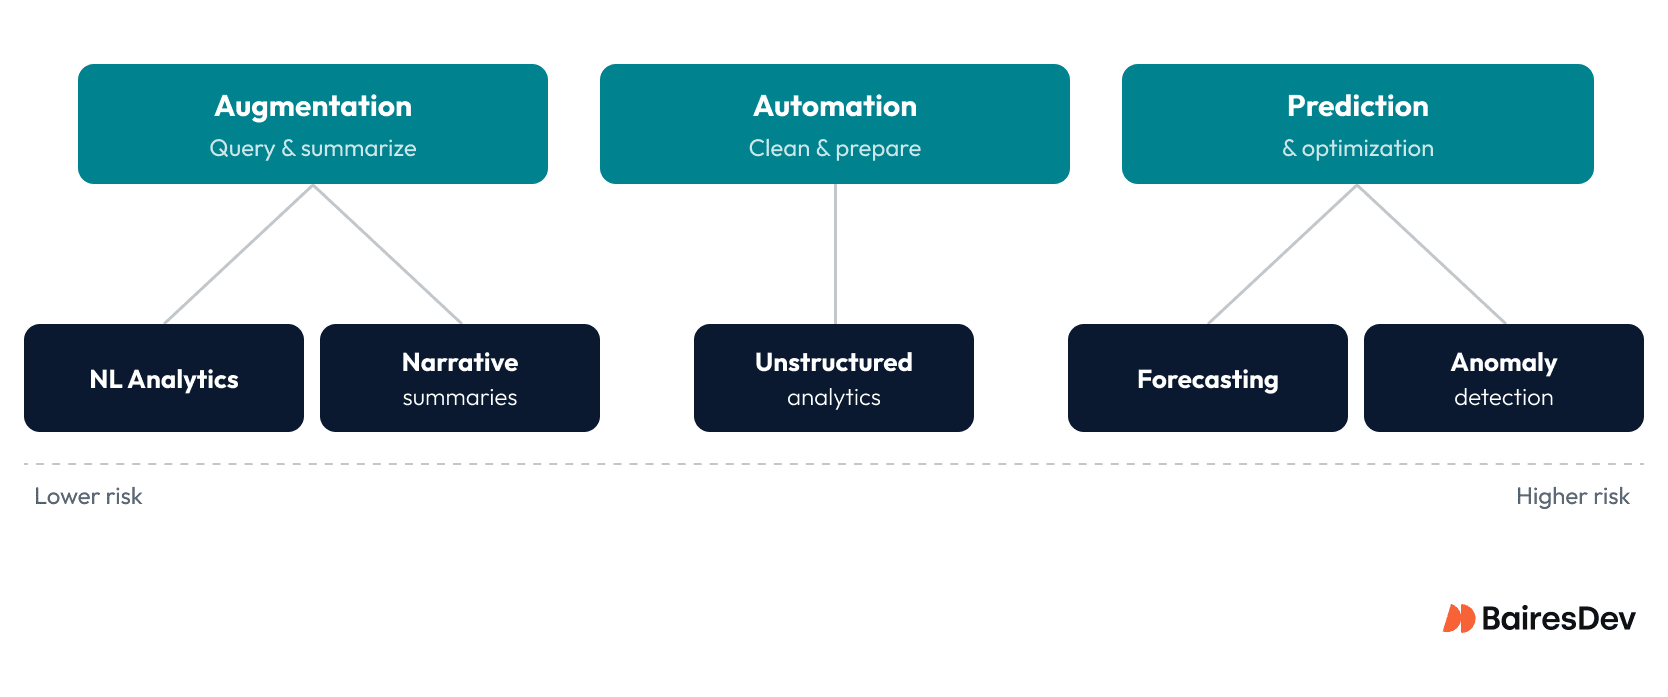
The first tool is augmentation, which often focuses on natural language processing. In current analytics tools, NLP capabilities are often delivered through large language models. The strength of these tools is the ability to summarize data and query data using natural language. When implemented well, this makes data more accessible to teams, which can help them make decisions faster.
The second use case is automation. Automation excels at reducing repetitive work, such as data preparation, cleaning, and report generation. Much of this can be handled by deterministic pipelines based on rules. AI earns its place specifically where the work requires judgment or pattern recognition that is hard to encode as fixed rules, for example, classifying messy records or surfacing likely issues with data quality. The goal is to reduce the load of monotonous work on analysts.
Finally, there is prediction/optimization. These tools aren’t about augmenting the workflow; they are analytical tools. AI, in this case, means machine learning and statistical inference. These tools leverage pattern recognition to forecast outcomes, detect anomalies, and/or recommend actions.
Most strategies will deploy a combination of all three. But each should be evaluated separately. The more automation that is introduced into decision-making, the higher the bar for acceptance needs to be.
What the use cases look like in production
These AI patterns tend to show up in five production situations. The details will vary, so focus on the core problem you are trying to solve.
Would teams benefit from asking data questions in natural language instead of structured queries? Could teams benefit from summaries of charts and analysis outputs? Do you have a lot of historical data and want to forecast future outcomes? Do you need to catch gradual anomalies in important metrics before they become visible problems? Or do you have a lot of unstructured data that is hard to process using traditional data analysis techniques?
Focus on the problem area first. But these are not discrete categories, it is likely that there will be overlap.
Natural Language Analytics
Natural language processing (NLP) tools, today typically running on large language models, excel at addressing the first two situations. Reach for these tools when you want input or output in natural language. But building a system for NLP input has different considerations than NLP output systems.
When creating a system designed to query in natural language, a critical concern is what access you should grant the AI tool. It should not have unrestricted access to raw tables. The accessible data must be restricted to a governed semantic layer. Every response generated by the tool must map back to data from an approved source and data that has been validated.
There is a real risk of the tool spreading misinformation if this architecture is not well thought out.
Start by treating natural language as just another query interface for the existing analytics layer. Metrics are defined once, owned by data teams, and exposed through a semantic model with clear dimensions, filters, and access controls. The AI generates queries against that layer, not against the warehouse directly. This preserves consistency with traditional dashboards and keeps results aligned with how the business already measures performance.
This will require some groundwork to set up. First, performance indicators must be explicit, documented, and machine-readable. Second, permissions must flow through the entire stack. If a user cannot see certain data in a BI tool, they should not be able to access it through natural language queries. Third, generated queries and results need traceability. Knowing who accessed what data should be auditable.
But the benefit of getting this right can return on this investment. Shifting queries to natural language and away from structured queries can give non-technical staff greater access to data and analysis. This can democratize data access across a company. But poorly done, it can undermine confidence in all reporting.
Narrative Generation and Automated Summaries
NLP can also be used to produce narrative summaries. Don’t think of this as replacing existing reporting, rather its role is to enhance the interpretation of reports. NLP can be used to produce summaries such as weekly business reviews or explanations of data visualization changes. It is a relatively low-risk integration option because it is downstream of existing reporting rather than replacing it.
In practice, these systems work best when they are scoped narrowly. The AI extracts key insights from existing reports and generates human-readable explanations. The underlying numbers still come from the same analytics tools already trusted.
The key limitation is authority. Generated narratives should be treated as drafts, not sources of truth. Teams that succeed make this explicit by linking summaries back to the underlying datasets and dashboards, so readers can verify claims.
Machine Learning in Analytics
Whereas NLP focuses on making existing insights more accessible, machine learning (ML) focuses on finding patterns that are hard to define manually. Its strength is anticipating outcomes, classifying records, segmenting users, and detecting patterns at scale. Depending on the use case, it requires historical data, labeled data, or representative examples to transform raw data into actionable intelligence.
The limitation of these approaches is that they are based on a snapshot of the past. But the real world does not stand still. As user behaviour changes, market conditions change, and your products evolve, so too will these predictive models need to adapt. If the models are not updated, a model that was very accurate can slowly and silently become less reliable over time.
This gradual loss of accuracy is called “model drift”. Teams will need to regularly monitor the models performance and regularly retune models with the latest data. These are not one-and-done solutions. But they can enhance forecasting and anomaly detection analysis.
Forecasting and Predictive Analytics
Demand, churn, and capacity forecasting are well-suited for ML approaches. But the implementation cost here is higher than most teams expect, and classical statistical methods are often a competitive and cheaper baseline worth trying first.
Maintaining accurate forecasts will require operational discipline. Models require clearly defined inputs and need a schedule to be retrained as those inputs change over time. Monitoring the outputs will be essential to determine appropriate timelines for retuning. Should something go wrong, teams will also need a clear rollback plan. This ongoing maintenance work typically falls to platform designers or data science teams, as it requires a different skill set than traditional business analysts.
This is not a set-and-forget capability. Leaders should tie forecasts directly to specific decisions and measure whether those decisions improve over time. Model accuracy alone is not enough if the outputs do not reliably change outcomes.
Anomaly Detection and Alerting
Anomaly detection is designed to address a gap in traditional analytics: how can we catch slowly growing problems that we don’t notice until it is too late. For example, imagine your conversion dips two percent each week for a month. Each individual dip may fall within an acceptable range, but collectively signal trouble. ML can be trained to learn the rhythm of normal operation and recognize when there are subtle deviations that may be missed by rule-sets.
The goal here isn’t building a sophisticated model that detects everything. You want a system with broad coverage focused on critical metrics. In production, the most effective implementations are narrow and boring. Teams pick a small set of business or operational metrics they already care about and layer anomaly detection on top of existing monitoring. When something triggers, it lands in the same alerting or analytics workflow the team already uses, with enough context to decide whether action is needed.
A common pitfall is treating anomaly detection like a crystal ball. Monitoring every data point in hopes to find unknown unknowns can create too many false positives and generate noise instead of insights. Teams will quickly learn to ignore anomaly reports if they do not deliver value. Teams that get value assign ownership, review alerts regularly, and disable detectors that are not leading to action.
The payoff is earlier detection of real issues, not more alerts.
Unstructured Analytics at Scale
Unstructured analytics focuses on making sense of datasets that do not map well to databases. Think transcripts, documents, and logs. These data sources are rich with information, but difficult to extract the data. Generative AI can help here. Generative AI can use a suite of tools to extract, classify, and summarize large diverse data sources.
The downside of these systems is that the resulting output cannot be trusted. These models are probabilistic by nature, especially when dealing with noisy unstructured data. This can create plausible, but incorrect conclusions. The output will need to be validated. Generally, this is done by taking a subset of the data and having a human review it to verify the validity.
A good use case for generative AI is to develop a triage mechanism. The AI can scan vast amounts of data, group the data by theme, and prioritize tasks. For example, a customer support team could find such a tool useful to group tickets by theme and prioritize them by highest impact. The responses are not automated, humans are still in the loop, but the AI can help direct their resources for the highest impact.
| Use case | What it does in practice | Best fit problem | What it needs to work well | Main risk or limitation |
| Natural language analytics | Lets users ask questions in plain language and get answers from governed data | Making analytics more accessible to non-technical users | A governed semantic layer, validated metrics, end-to-end permissions, and query traceability | If it queries raw data or uses unclear definitions it can return convincing but wrong answers |
| Narrative generation and automated summaries | Turns charts, dashboards, and reports into readable summaries | Helping teams interpret reporting faster without replacing it | Trusted reporting inputs, narrow scope, and links back to source dashboards or data | Generated summaries can sound authoritative even when they should only be treated as drafts |
| Forecasting and predictive analytics | Uses historical data to estimate future outcomes such as demand, churn, or capacity | Supporting planning and decision-making where future conditions matter | Clean historical data, defined model inputs, retraining schedules, monitoring, and rollback plans | Models can become outdated as conditions change and accuracy alone does not guarantee business value |
| Anomaly detection and alerting | Detects unusual changes in important metrics that may not trip fixed rules | Catching slow-building problems or subtle deviations earlier | Historical baselines, clear metric ownership, alert workflows, and regular review of signal quality | Too much scope creates noise and false positives that teams will learn to ignore |
| Unstructured analytics at scale | Extracts patterns and meaning from transcripts, documents, logs, and tickets | Working with large volumes of text or other messy data that do not fit neatly into tables | Good source data, validation by human review, and a workflow that keeps humans in the loop | Outputs are probabilistic and can produce plausible but incorrect conclusions if not validated |
Where Generative AI Helps and Where it is Dangerous
Generative AI has expanded what teams can do with data analytics, but it also introduces new risks. The safest uses are assistive by default. Exploration, summarization, query assistance, and explaining analysis are strong fits. They help data analysts and data scientists move faster without changing authoritative outputs.
High-risk uses include authoritative KPI reporting, financial or regulatory outputs, and automated actions without human review. In these cases, hallucinations or subtle errors can directly impact business decisions. But accuracy isn’t the only risk. People can also trick the AI with hidden commands (called prompt injection), or the system could accidentally leak sensitive data. That is why the safety rules below are mandatory.
Practical guardrails include grounding outputs in approved data sources, requiring citations or traceability, and enforcing human review for high-impact results. These controls are not optional at enterprise scale.
Data and Platform Prerequisites
Before scaling AI analytics, leaders need to be honest about whether their data foundations are ready. Most failures at this stage are not model problems. They are existing analytics issues that become more visible once AI is layered on top.
Semantic consistency matters more than model sophistication. If teams disagree on metric definitions or apply different filters to the same KPI, AI powered systems will not resolve that ambiguity. They will amplify it. Successful teams define metrics once, make them machine-readable, and ensure that both humans and AI tools are querying the same semantic layer.
The foundation of the data must be solid. Analytics AI is only as trustworthy as the data behind it. Transparent lineage is essential to allow you to trace data back to its origin. You do not need perfection, but you need enough visibility to explain when answers are wrong.
Permissioning must extend to AI interfaces. If an employee cannot see a dataset with your current analytics tools, it should not be visible once an AI layer is added. This sounds obvious, but remains a common enterprise gap.
Finally, integration matters more than novelty. Teams that see durable value tend to embed AI analytics into existing systems like warehouses, BI tools, data catalogs, and operational workflows, rather than introducing a separate AI surface that users have to learn and trust from scratch.
Before You Deploy AI in Analytics Checklist:
- Start with one clear use case tied to a business problem.
- Ground the system in governed metrics, trusted data, and inherited permissions.
- Define success upfront in terms of time saved, decision speed, or business impact.
- Assign clear ownership for quality, monitoring, and rollback.
- Evaluate bias and fairness when outputs affect people, customers, or resource allocation.
- Keep humans in the loop wherever outputs could affect high-impact decisions.
Evaluation and Operating Model
One of the fastest ways to lose trust in AI analytics is treating evaluation as subjective. Enterprise teams need explicit success criteria tied to outcomes they already care about, not just whether a demo looks impressive.
What success means varies by capability. Automation should be measured in time saved and reductions in manual data entry. Augmentation should reduce decision latency or increase analyst throughput. Predictive systems need to show not only accuracy, but stability over time and a measurable impact on business decisions.
How teams evaluate these systems also differs. Natural language analytics benefits from regression tests that ensure the same questions continue to produce consistent results as prompts or models change. Predictive systems require ongoing monitoring for drift. Across all patterns, sampling and human review remain essential, especially when outputs influence high-impact decisions.
Ownership is the final piece. Someone needs to be accountable when AI analytics breaks, produces confusing results, or degrades quietly over time. Changes should be versioned, tested, and reversible, just like any other production system. Without a clear operating model, even well-designed AI analytics will eventually lose credibility.
Closing Perspective
AI in data analytics is not a single capability. It is a set of patterns that change how teams analyze data, interpret results, and support business decisions. Some of those patterns are mature and low-risk. Others introduce real operational and governance costs that leaders need to plan for up front.
This shift does not remove the need for skilled data analysts or data scientists. It changes where their time goes.
Less effort is spent on repetitive analytics tasks and manual data preparation. More effort goes into defining relevant data, validating insights, and making sure AI-assisted outputs are trustworthy in production. The opportunity is not replacing people, but improving effective data analysis across the organization without creating new sources of risk.
The teams that struggle tend to treat AI analytics as just another feature. The teams that succeed treat it as production infrastructure. They are deliberate about where AI helps, explicit about boundaries, and disciplined about ownership and evaluation. Used this way, AI analytics can reduce toil, improve consistency, and surface insights that were previously impractical. Treated as magic, it quietly creates parallel systems and unclear accountability, and the costs show up later.