

Key Points:
- Recurring WordPress performance problems usually come from fixing the wrong layer first.
- The bottleneck typically sits in one of six layers, and the layer determines budget, scope, and ownership.
- A quick TTFB test often tells you more than weeks of unfocused plugin review.
- Teams that sustain performance treat it like an SLA, with budgets, ownership, and review cadences.
Most WordPress performance advice is written for the person applying the fixes. This article is for the person deciding which fixes are worth funding, who owns them, and when the work has outgrown in-house capacity.
If you’ve inherited a slow WordPress site, odds are you’ve seen checklist fixes outright fail to deliver. Someone added a caching plugin, compressed images, or maybe switched to a lighter theme. Metrics briefly improved, but then the complaints came right back.
The cause is usually the same: teams apply fixes without identifying the layer that’s actually failing. That whack-a-mole approach drives rework, ranking loss, and engineering time spent solving the same problem twice. You need to start looking at individual layers.
Why Single-Layer Fixes Keep Failing You
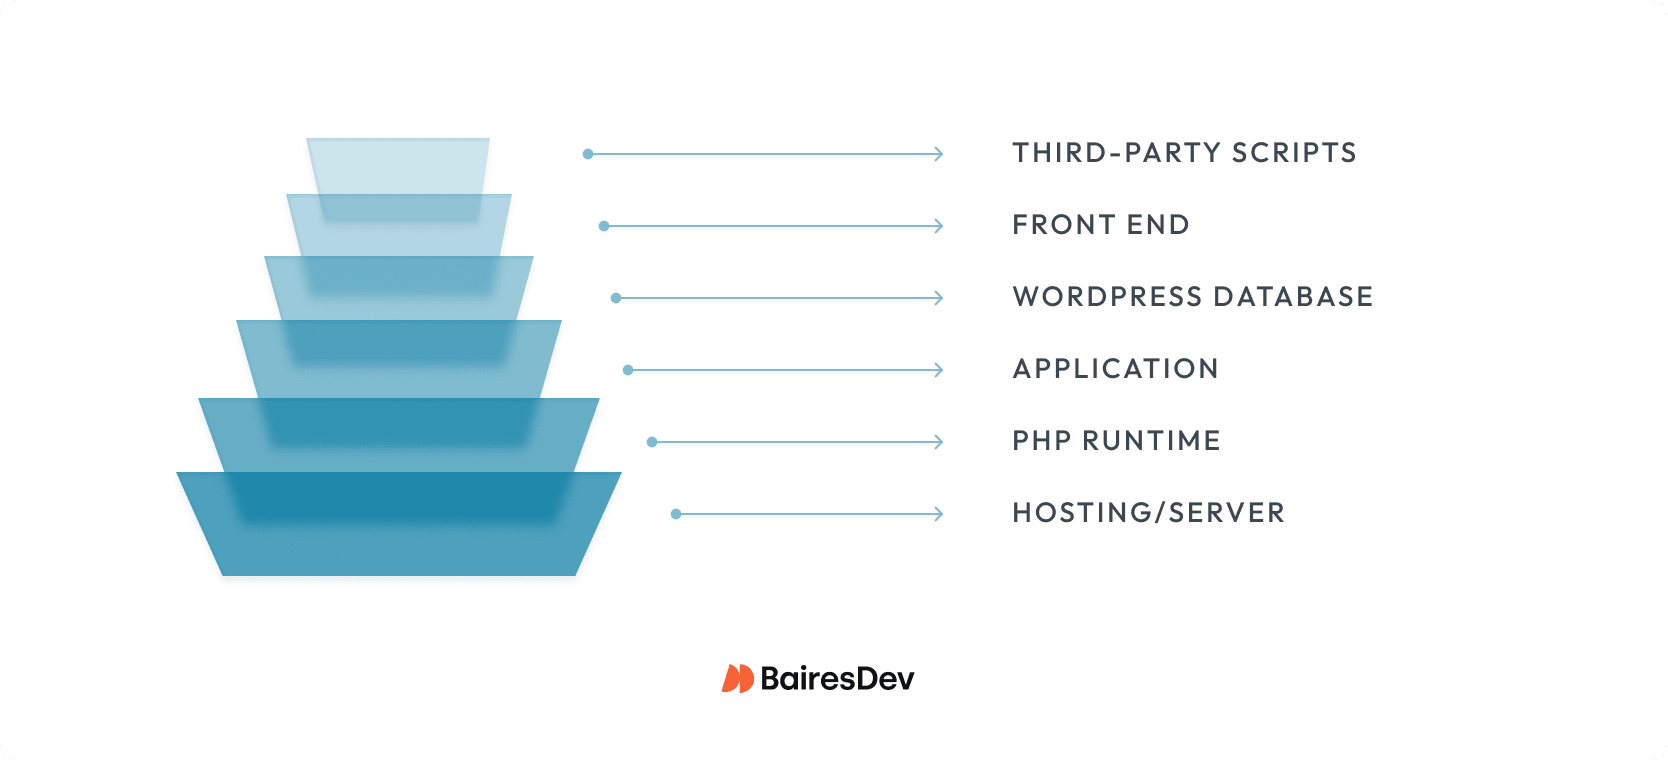
A WordPress site runs across six interdependent layers: hosting, PHP runtime, the application, the database, front-end delivery, and third-party scripts. Each has its own performance ceiling. Your site is only as fast as its tightest bottleneck. That’s why WordPress performance rarely behaves like a single bug with a single fix.
A common pattern looks like this: a team spends two sprints optimizing images, tweaking multiple plugins, and deferring JavaScript. They ship a modest LCP gain, but the site still feels slow. The real bottleneck was server response time, not front-end weight. The work was real, but it didn’t solve the business problem.
Two questions scope the project correctly. Which layer is the binding constraint, and who owns it? Answer these questions first, and you avoid spending time on the wrong work.
| Layer | What Goes Wrong | How You Spot It |
| Hosting/Server | Caps every other performance investment | TTFB > 800ms on a clean install |
| PHP Runtime | Adds baseline overhead to every request | Slow response with minimal plugins |
| Application (Plugins/Themes) | Scales badly as plugins and content grow | Response degrades with plugin count |
| WordPress database | Erodes invisibly until it crosses a threshold | Slow query log, response times that grew over months |
| Front End | Degrades what users actually feel | High LCP, render-blocking assets in waterfall |
| Third-Party Scripts | Binds your performance to vendors you don’t control | Waterfall gaps from external domains |
Where WordPress Performance Bottlenecks Usually Live
Hosting and Server Environment
Hosting is the first place to look because it sets the ceiling for everything else. If the server is slow before WordPress even assembles the page, downstream optimization won’t meaningfully improve site performance or move the metrics your business cares about.
A practical triage benchmark is TTFB around 0.8 seconds or lower. TTFB isn’t a Core Web Vital, but server response time still shapes LCP. If the server is slow, front-end work starts from a weaker baseline.
Three things control hosting-layer performance. All three are budget conversations framed as technical ones.
- What you’re actually paying for: Shared hosting providers cap your peak-traffic performance at whatever your noisiest tenant is doing. Managed WordPress and dedicated cloud instances cost more but give you predictable server resources. The cost difference is almost always smaller than the business cost of one bad launch day.
- Caching at the right layers: Object caching, page caching, and opcode caching each solve different problems, and they aren’t substitutes for each other. Teams usually have one or two in place and assume they’re covered. The missing layer is typically the one that actually moves their numbers.
- CDN coverage for your actual audience. If your buyers are distributed, a content delivery network (CDN) is the difference between a one-second page load at HQ and six seconds in the regions where half your pipeline sits.
The fast way to scope all of this: measure TTFB under controlled conditions with minimal plugins active to isolate hosting from application overhead. If TTFB is already high under controlled conditions, treat server-side performance as the first bottleneck. Otherwise, you risk spending effort you’ll have to repeat later.
PHP Runtime and WordPress Core
If your WordPress properties are still running PHP 7.x in 2026, you already have a security and governance problem. PHP 7.4 lost security support in November 2022. If it’s still in production, the issue is usually budget, ownership, or unresolved upgrade risk.
Within supported PHP 8.x versions, runtime differences are rarely the main constraint on WordPress performance. Once you’re on a supported branch, bigger bottlenecks usually sit in the database, plugins, or file I/O. The urgent move is getting off 7.x, not chasing marginal gains between recent 8.x releases.
WordPress core follows the same pattern. Teams that delay updates rack up security exposure, compatibility risk, and upgrade debt. Usually, the root problem is simple: nobody owns core updates until an outdated plugin breaks.
Themes and Plugins Require Governance
Plugin and theme overhead is as much a governance problem as an engineering one. Every plugin adds queries, assets, or API calls to the request path. You think you have too many plugins? Possible, but the actual count matters less than whether anyone owns the audit on what those dependencies do in production.
These four patterns cause most of the damage:
- Overlapping functionality: Two plugins doing similar work or loading the same library. You pay for it on every request.
- Global assets from inactive plugins: A contact form plugin loading CSS and JavaScript on checkout pages because it enqueues everywhere by default.
- Synchronous external API calls at render time: A plugin that blocks on an external service turns someone else’s uptime into your TTFB. When that vendor slows down, your site slows down with it.
- Theme lock-in from multipurpose themes and page builders: Multipurpose themes and page builders often ship far more code than the site needs. Replacing them becomes a multi-quarter project, which is why theme choice deserves more scrutiny than most teams give it.
In most cases, the limiting factor isn’t know-how, as you probably have people on the team who can analyze and clean up the mess. However, the people best equipped to run this audit are usually committed to roadmap work already.
WordPress Database Activity
The database is where WordPress performance debt likes to hide. Server and front-end issues surface quickly; database issues build up quietly until they become impossible to ignore.
Three patterns drive most of the invisible accumulation:
- Table tables: WordPress does not clean up post revisions, expired transients, spam comments, or orphaned metadata on its own. After a few years, most installs are carrying data the current site no longer needs, resulting in table bloat.
- Autoload bloat: Every page request loads all “autoloaded” options from wp_options. Site Health flags a critical issue when that payload exceeds 800KB. WordPress 6.6 shipped default-behavior changes because this was happening too often to ignore. Unfortunately, a lot of teams never audit what’s in their autoload table. There’s almost always an unnecessary plugin from three years ago still adding to it.
- Unindexed queries that scale with content volume: A query that runs fine in development and fine in staging can become catastrophic in production after two years of content growth. The warning signs usually show up in the slow query log for months before anyone notices. And that’s if anyone is looking.
The practical question is simple: when did someone last audit the autoload table, prune orphaned metadata, and review the slow query log? If the answer is ‘never’ or ‘nobody owns it,’ you’re already carrying technical debt.
Front-End Delivery
The front end is where every website performance investment either pays off or doesn’t. It is also getting harder to control: between 2015 and 2025, median mobile page weight rose from 845 KB to 2,362 KB, a 202% increase.
User patience didn’t keep up, and the gap shows up in conversion, bounce, and search visibility.
Most front-end performance problems are well understood: render-blocking assets, unoptimized images, bloated pipelines. The harder problem is accountability. Many WordPress properties still have no page-weight budget, no review cadence, and no release discipline around regression.
Core Web Vitals need named ownership because they map directly to user experience and business outcomes. The teams that manage this well treat front-end regressions like failing tests. If something got worse, then someone is accountable for fixing it.
Third-Party Scripts and External Dependencies
Third-party scripts often originate outside engineering, but they still consume main-thread time on your critical path. That’s how teams end up with a well-optimized page that still feels slow because analytics tags, chat widgets, or embeds are competing for execution time.
Every external script is a vendor dependency with a latency cost. The practical question is whether its value justifies that cost, and who is responsible for owning the tradeoff.
Individually, most scripts look reasonable. Collectively, they create unbudgeted latency. The fix is simple. Define who approves them, what budget they must clear, and when they get reviewed again.
| Layer | Typical Symptoms | Key Metric | Typical Owner |
| Hosting/Server | High TTFB, timeout errors | TTFB | Infrastructure/DevOps |
| PHP Runtime | Slow response, high CPU | Server response time | Platform/DevOps |
| Plugins/Themes | Degradation with scale | Per-request query count | Development |
| Database | Growing response times | Slow query log | Development/DBA |
| Front End | High LCP, layout shifts | LCP, CLS | Web / Front-end |
| Third-Party Scripts | Post-load sluggishness | INP, waterfall gaps | Marketing + Engineering |
Diagnosing WordPress Performance Issues by Layer
Run this sequence in order. Each step narrows the problem and clarifies ownership.
- Start with TTFB under controlled conditions with minimal plugins active: If server response is already high, treat server-side performance as the first bottleneck. Otherwise, you risk spending budget on the wrong layer.
- Run a waterfall analysis: WebPageTest or browser DevTools will separate server wait, asset loading, third-party calls, and render-blocking time. That turns ‘the site feels slow’ into assignable work.
- Run Query Monitor on your slow pages: It surfaces per-request queries, plugin overhead, and HTTP API calls. That usually makes the expensive dependency visible quickly.
- Map findings to Core Web Vitals: The three vitals give your team and your stakeholders a shared vocabulary and thresholds you can track over time rather than reiterating priorities every sprint.
| Metric | Threshold (Good) | What It Measures | Primary Layer |
| LCP (Largest Contentful Paint) | 2.5s or less | Loading performance | Server + Front end |
| INP (Interaction to Next Paint) | 200ms or less | Responsiveness | Front end + Third-party JS |
| CLS (Cumulative Layout Shift) | 0.1 or less | Visual stability | Front end |
On script-heavy WordPress properties, INP is often the hardest metric to improve because the problem sits in JavaScript execution and third-party code, not page load alone.
- Set performance budgets and track them: Use the same dashboards your team already reviews. Without named thresholds, performance drifts between audits.
From Checklists to Engineering
A caching plugin won’t fix a slow database query, and image compression won’t solve poor server response. Teams that optimize before nailing down the binding constraint usually defer the problem rather than fix it.
Teams that manage WordPress performance well usually put three things in place: clear ownership by layer, performance budgets in regular dashboards, and a deliberate decision about what stays in-house.
Monday morning version: measure TTFB with minimal plugins active. Then run Query Monitor on your slowest pages and map the findings to the layer table. Assign each issue to the owner of that layer. This sequence will tell you more about where to spend than another round of generic optimization.


