
By Leo Hart
Leo is a technology executive with more than 25 years of experience leading large-scale software organizations through modernization, turnaround, and growth. He currently serves as Chief Technology Officer at Showpad.
Expertise



Executive Summary
This article argues that most engineering productivity metrics fall into three tiers: those that work reliably, those that actively backfire, and those that work only when specific preconditions are met. The author presents a four-condition framework for evaluating metric readiness and addresses how standard metrics break down in distributed and embedded team environments.
Every CTO I know has sat across from a board member, a CFO, or a skeptical peer and been asked some version of the same demand: prove it. Prove the platform investment paid off. Prove the reorg didn’t slow anyone down. Prove that the team is more productive this year than last. And every CTO I know has, at some point, reached for a number that didn’t actually hold up under that pressure.
That’s the real problem in this space. Engineering leaders measure plenty. Most of what gets measured is the wrong thing, dressed up convincingly enough to survive a first pass and collapse under a second one. CTOs are being asked to defend numbers they never fully trusted in the first place, because the alternative, saying “it’s complicated,” doesn’t play well in a budget review.
I’ve spent enough time on both sides of this conversation, building the dashboard and being asked to explain it, to have developed some strong opinions about which metrics survive scrutiny, which ones actively make things worse, and which ones only work if you build the right scaffolding around them first. This piece is about that third category. It’s the least discussed part of the productivity metrics conversation, and the part that actually determines whether any of this is worth doing at all.
Three Tiers of Engineering Metrics: What Works, What Backfires, and What Depends
Most writing on engineering productivity metrics picks a side. One camp says DORA metrics (deployment frequency, lead time for changes, change failure rate, and time to restore service) are the answer, full stop. Another camp says all quantitative productivity metrics are a trap, that engineering work is fundamentally qualitative, and that any attempt to reduce it to a number will be gamed, misread, or both.
Both camps are half right, which is another way of saying both are incomplete. The honest answer is that engineering metrics split into three tiers, and almost none of the public discourse spends real time on the third one.
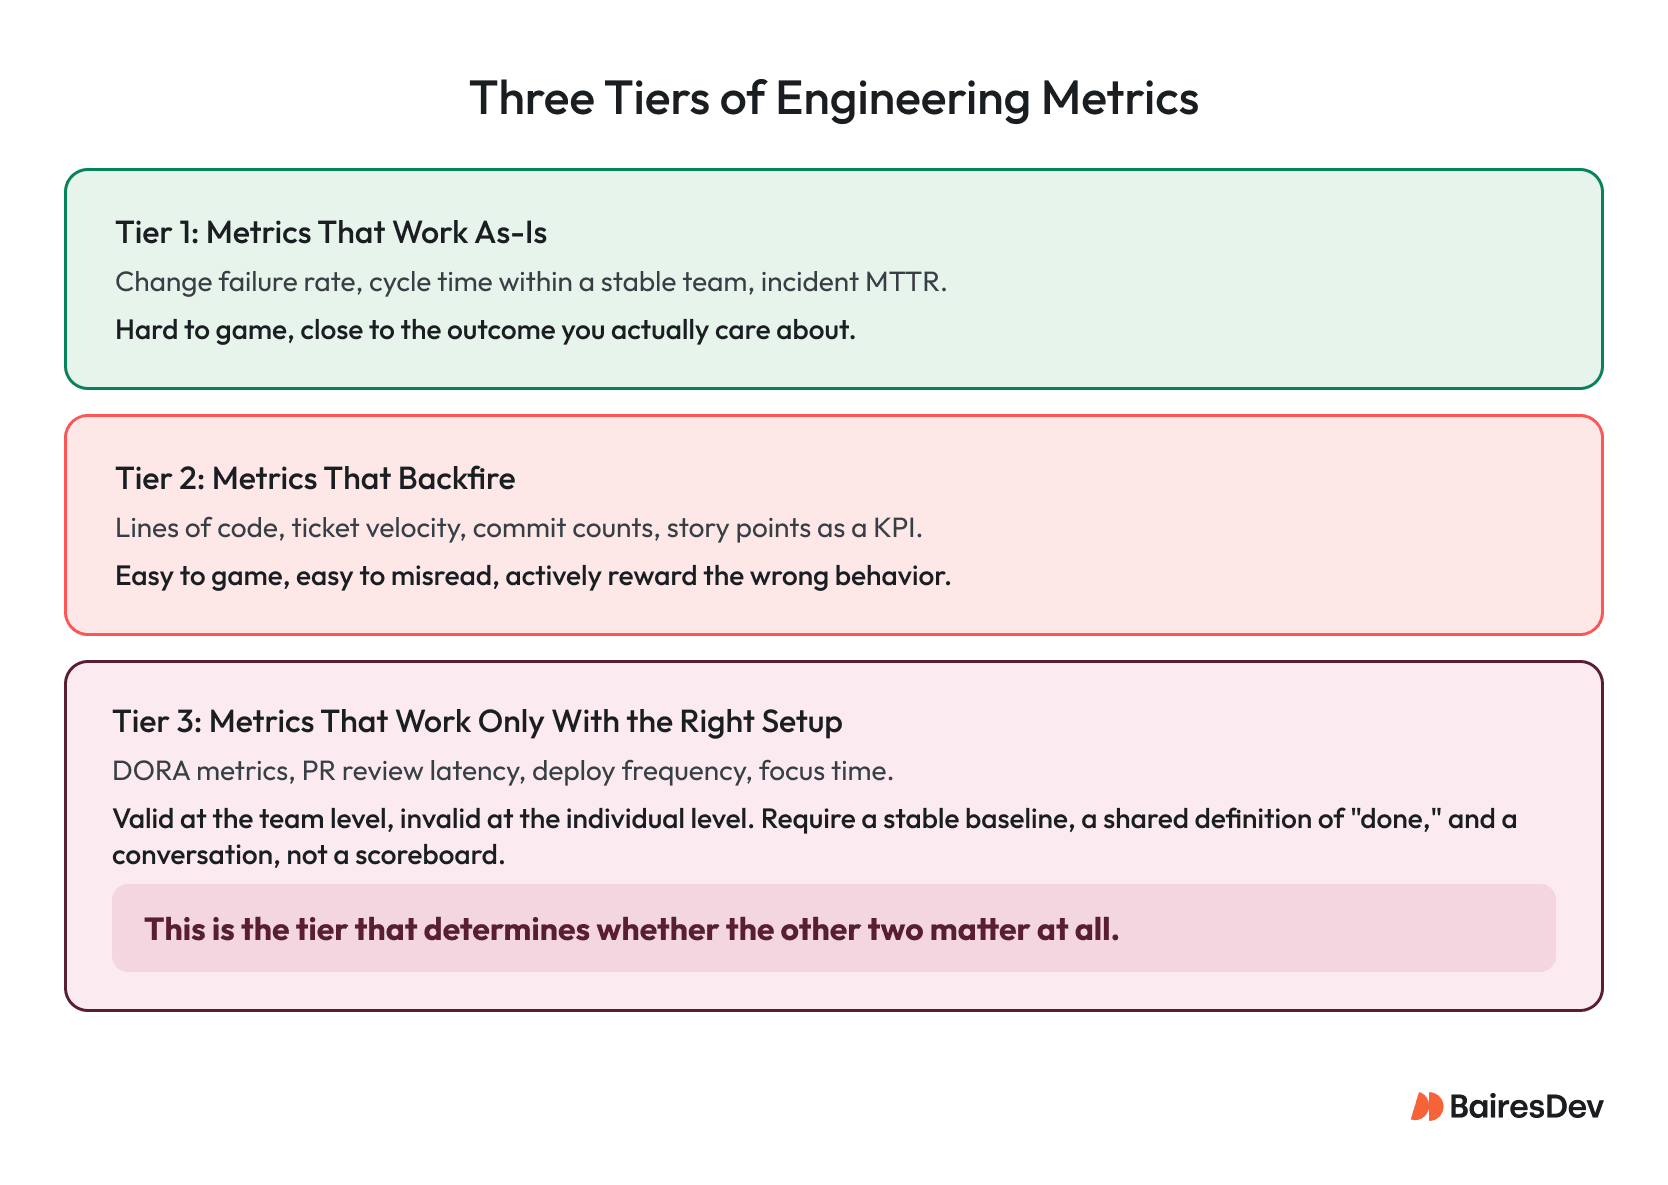
- Tier one: metrics that work close to as-is. These are the numbers that are hard to game and stay close to the outcome you actually care about. Change failure rate, incident MTTR, cycle time inside a single stable team over a long window. They aren’t perfect, but they’re honest enough that you can put them in front of a board without a lot of caveats.
- Tier two: metrics that backfire. These are the numbers that look like productivity signals and are actually just activity signals. The moment you attach incentives or narrative to them, people (rationally) start optimizing for the number instead of the outcome.
- Tier three: metrics that work, but only with the right setup. This is everything in between, most of the well-known frameworks included, and the tier that decides whether the first two even matter. A change failure rate is meaningless if your team doesn’t have a shared definition of what counts as a “change” or a “failure.” A DORA scorecard rolled out without team-level baselining just becomes a new version of tier two.
That third tier is the centerpiece of this piece, and I’ll get to it in detail. But first, it’s worth being specific about tier two, because vague warnings about “gaming metrics” don’t change anyone’s mind. Concrete examples do.
The Metrics That Backfire, Named
Three metrics deserve to be named directly, because they still show up in leadership dashboards more often than anyone in engineering would like to admit: lines of code, ticket velocity (tickets closed per sprint), and effort delivered (story points or estimate-based throughput).
Lines of code as a productivity signal has been discredited for decades, and it still creeps back in, usually disguised as “commit volume” or “PR count.” The problem is straightforward. It rewards verbosity over judgment, and it actively punishes the engineer who deletes three hundred lines of dead code to replace it with forty that do the same job better. If leadership ever ties this to recognition or comp, you will get more code, not better code, and probably not faster delivery either, because more code means more surface area to review, test, and maintain.
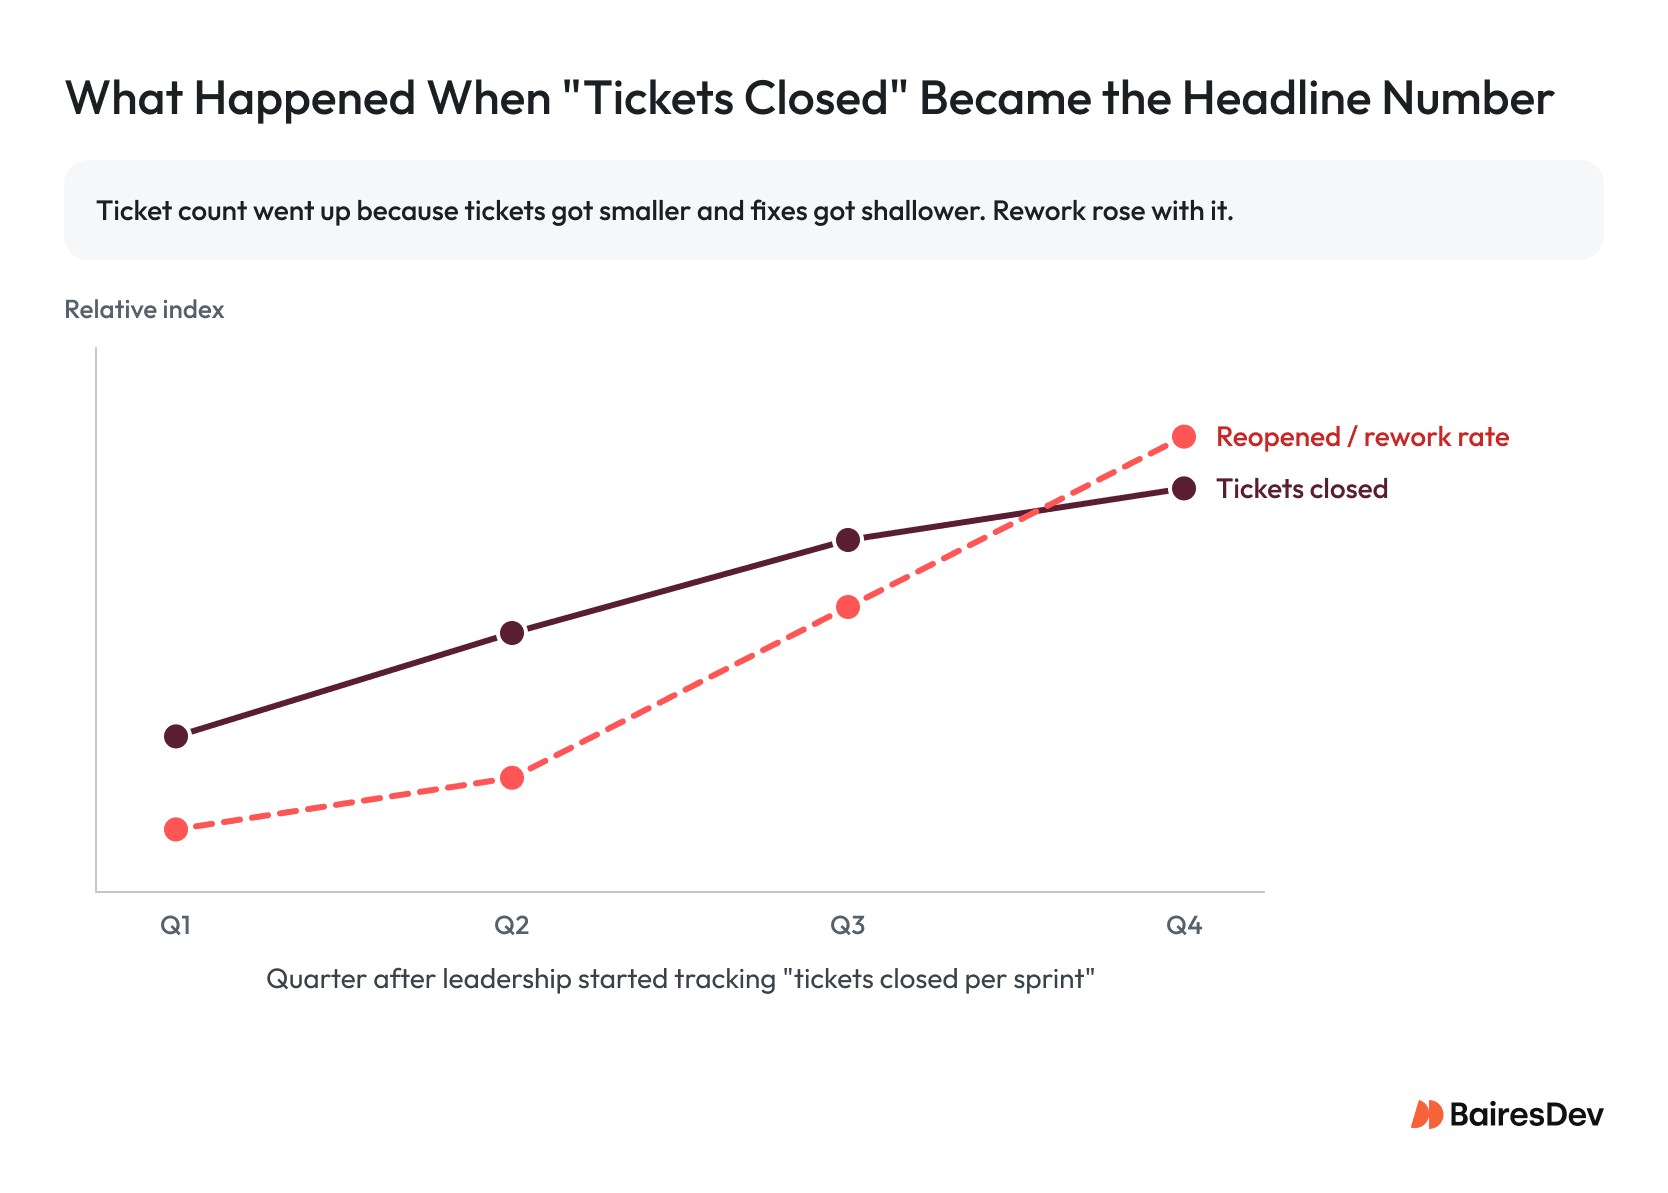
Ticket velocity is the more common trap today because it feels more sophisticated than lines of code, and it isn’t. Here’s an illustrative version of a pattern I’ve seen play out more than once. Suppose a mid-size engineering org starts reporting “tickets closed per sprint” up the chain as a headline productivity number. For two quarters, the number climbs, and leadership is thrilled. By the third quarter, someone on the support side notices that the reopen rate on closed tickets has climbed even faster than the close rate. What happened is exactly what you’d expect once you think about incentives. Tickets got smaller, so more of them could be closed in a sprint. Deeper root-cause work got deferred because it didn’t fit in a single ticket. The definition of “done” quietly shifted from “the customer’s problem is solved” to “the ticket’s status field says Closed.” Velocity went up. Rework went up faster. Nobody lied about the number, and the number was still wrong.
Effort delivered is the subtler of the three, and it’s becoming the more dangerous one precisely because of AI adoption. Story points, and any KPI built on top of them, measure the size and complexity of the work, not the value it produced. That was always a shaky proxy, but it used to at least move in a defensible direction; more effort, roughly, meant more got built.
AI-assisted development breaks that assumption directly. If a coding assistant lets a team deliver the same feature with meaningfully less estimated effort, a good outcome should show up as a falling points number, not a rising one. An organization that keeps reporting “points delivered” as its headline productivity metric through an AI rollout will watch the number it’s celebrating go down as the thing it actually wants (more value shipped for the same or less effort) goes up, and leadership will read the drop as a productivity problem instead of the win it actually is. Effort is the wrong axis to measure in general. It’s an actively misleading one the moment effort itself is what you’re trying to reduce.
The pattern across all three is the same. They measure output that’s easy to count instead of outcomes that actually matter. That’s Goodhart’s Law in practice; when a measure becomes a target, it stops being a good measure. It’s the single most important thing to understand before you build any productivity dashboard.
Tier Three: The Metrics That Only Work With the Right Setup
Here’s the thing most content in this space skips past: the metrics that get the most airtime (DORA metrics, PR review latency, deploy frequency, focus time, code review turnaround) are not inherently good or bad. They’re conditional. They work when a set of preconditions are in place, and they actively mislead when those preconditions are missing. Almost nobody writes about the preconditions, because “it depends” is a worse headline than “here are the four metrics that matter.” But the preconditions are the actual work.
There are four conditions I’ve found matter more than any others.
1. The metric has to live at the team level, never the individual level.
Deployment frequency, PR review time, cycle time, all of these are valid signals about a team’s system, its tooling, its handoffs, and its bottlenecks. The moment you attribute them to an individual engineer, you’ve changed what they measure, from “Is our system healthy?” to “Should this person be worried about their next review?” That shift changes behavior immediately. Engineers stop taking on the gnarly, slow, high-risk tickets because those tickets tank their personal numbers, and the work that most needs a strong engineer’s attention gets quietly avoided. A team-level DORA dashboard reviewed by the team itself is a diagnostic tool. The same dashboard sliced by name and reviewed by a manager in a 1:1 is a performance management tool wearing a diagnostic tool’s clothing, and everyone on the team will treat it accordingly.
2. The metric needs a stable baseline before it means anything.
A cycle time number is meaningless as an absolute. It’s only meaningful as a trend against that same team’s own recent history, because ticket complexity, system maturity, and team composition all shift the baseline in ways that make cross-team comparison close to useless. I’ve seen leadership compare a platform team’s deploy frequency against a product team’s and draw conclusions about which team was “more productive,” when the actual explanation was that one team owned a monolith with a two-hour test suite and the other owned a set of independently deployable services. The metric wasn’t wrong. The comparison was.
3. The metric needs a shared, written definition of the terms inside it, agreed to before the measurement starts.
What counts as a “change” for change failure rate? Does a rollback count as a failure if it was a planned canary rollback, not an incident? What counts as “lead time,” from first commit, from PR open, from ticket creation? Teams that skip this step end up arguing about the metric’s validity every time the number moves, instead of arguing about the underlying problem the metric was supposed to surface. Get the definitions agreed on paper before the first data point gets shared outside the team, not after someone disputes a number in a leadership review.
4. The metric needs a counterweight, a paired metric that would visibly suffer if the first one were gamed.
A single number, however well defined, can always be optimized in isolation. Pair a productivity signal with quality and predictability counterparts, and the three together create a natural tension. Pushing throughput at the expense of quality shows up in the quality number, and pushing throughput at the expense of stable delivery shows up in the predictability number. None of the three is perfect on its own. Together, they make gaming any single one visible almost immediately.
Putting the Preconditions to Work: Epic Throughput as a Test Case
I’ll admit where I’ve landed on this myself, because it complicates the clean story I just told about ticket velocity and effort delivered. At my current company, we do track a count, being epic counts closed per period. On paper that looks like the same trap as the examples above. The difference is in what an epic is and how it’s used. An epic in our system is a unit of value delivered, scoped and judged by product, not by the engineers doing the work. I chose it deliberately as close to a true value metric as I could get without also folding in product’s own skill at choosing the right things to build in the first place. An epic can be delivered perfectly and still have been the wrong bet, and I want that question kept separate from whether engineering executed well.
It also, by design, doesn’t measure effort or complexity the way points do, which matters for the same reason effort delivered is a trap. As AI and process changes take hold, the effort behind a given epic should shrink, not stay flat. I’d rather count the value unit than the labor unit.
I want to be clear about where this actually stands. It’s a theory I’m still testing, not a proven ROI story. What we have so far is a genuine correlation, not yet causation, between epic throughput, merge request volume, and AI-assisted development. But that shift came alongside deliberate people, process, and technology changes, so no single variable is isolatable yet. I say that to stakeholders as plainly as I say it here.
But the number by itself still isn’t the point, and I’m explicit about that with the team. The outcome matters, not the measurement, and if the KPI climbs without a matching improvement in outcome, that’s a bad sign worth investigating rather than celebrating. I pair epic throughput with quality and predictability metrics specifically so that trade-off surfaces somewhere if it exists. And with stakeholders, I say the quiet part out loud: this measure is imperfect, it’s better than what most organizations have, and we will change or drop it the moment the flaws outweigh the benefit. That last commitment matters as much as the metric itself. A leadership team that hears, “here’s our number, and here’s exactly how we’d know if we should stop trusting it,” reacts very differently than one handed a scorecard with no expiration date.
When those conditions are in place, tier three metrics become genuinely powerful, arguably more useful than the “safe” tier one metrics. Tier three surfaces systemic bottlenecks (a review queue that’s backed up, a test suite dragging on deploy frequency, a dependency that’s quietly become a chokepoint) well before those bottlenecks show up as a missed deadline. When those conditions are absent, the same metrics become tier two with better branding. The setup matters more than the framework.
What This Actually Means for a CTO Defending These Numbers
If you’re the one being asked to prove impact, the version of this that holds up in a board conversation isn’t “here are our four DORA metrics.” It’s a shorter, more defensible claim. These are the two or three signals we trust at the team level, here’s the baseline we’re comparing against, here’s why we don’t report metric X at the individual level.
That’s a harder pitch to make than a single productivity score, but it’s the one that survives a second round of questions because a second round of questions is exactly what’s coming.
The metrics that work are the ones you can explain the failure modes of, out loud, to the person asking you to defend them. If you can’t say what a number would look like if your team were gaming it, you don’t understand the metric well enough to be reporting it yet.
Key Takeaways
- Engineering metrics split into three tiers, and the tier that matters most is the one nobody writes about: metrics that work only with the right setup.
- Lines of code, ticket velocity, and effort delivered have no place on a leadership dashboard. All three measure activity, not outcomes, and incentivize exactly the wrong behavior.
- Any metric attributed to an individual engineer stops being a diagnostic tool and starts driving self-protective behavior.
- A metric without a counterweight can always be gamed in isolation. Pair productivity with quality and predictability signals.
- The metrics that hold up are the ones you can explain the failure modes of, out loud, to the person asking you to defend them.
Frequently Asked Questions
What are engineering productivity metrics?
Engineering productivity metrics are measures used to understand how effectively engineering teams deliver software. The most useful ones track team-level delivery, quality, reliability, and predictability rather than individual activity.
Which engineering productivity metrics should leaders avoid?
Leaders should avoid lines of code, ticket velocity, and effort delivered as headline productivity metrics. These metrics measure activity instead of outcomes and can encourage teams to optimize for the number rather than the result.
What is a counterweight metric?
A counterweight metric is a paired measure that shows whether one metric is being optimized at the expense of another. For example, throughput should be paired with quality and predictability signals so faster delivery does not hide more defects or instability.
By Leo Hart
Leo is a technology executive with more than 25 years of experience leading large-scale software organizations through modernization, turnaround, and growth. He currently serves as Chief Technology Officer at Showpad.
Expertise