

The outsourcing market in 2026 is reorganizing, not contracting. Global IT spending is accelerating, contract activity in the Americas has reached record levels, and demand for cloud and engineering services is rising. Meanwhile, U.S. tech hiring is uneven, immigration policy adds new friction, and enterprise buyers are consolidating vendors for more strategic partnerships.
This analysis focuses on software outsourcing, such as product engineering, application development, and platform work, rather than IT outsourcing broadly (infrastructure, managed services, operations) or business process outsourcing (non-engineering workflows).
For engineering leaders, the issue isn’t whether to use outsourcing providers, but how to do so effectively. They must consider how evolving labor markets, policy, and regional economics should reshape the deployment of external capacity.
Spending Is Growing, and Concentrating
Worldwide IT spending is projected to reach $6.15 trillion in 2026, a 10.8 percent increase over 2025, according toGartner’s latest forecast. Software spending alone will exceed $1.4 trillion, growing at 14.7 percent. Data center investment is accelerating even faster, with expectations that it will surpass $650 billion, up 31.7 percent YoY.
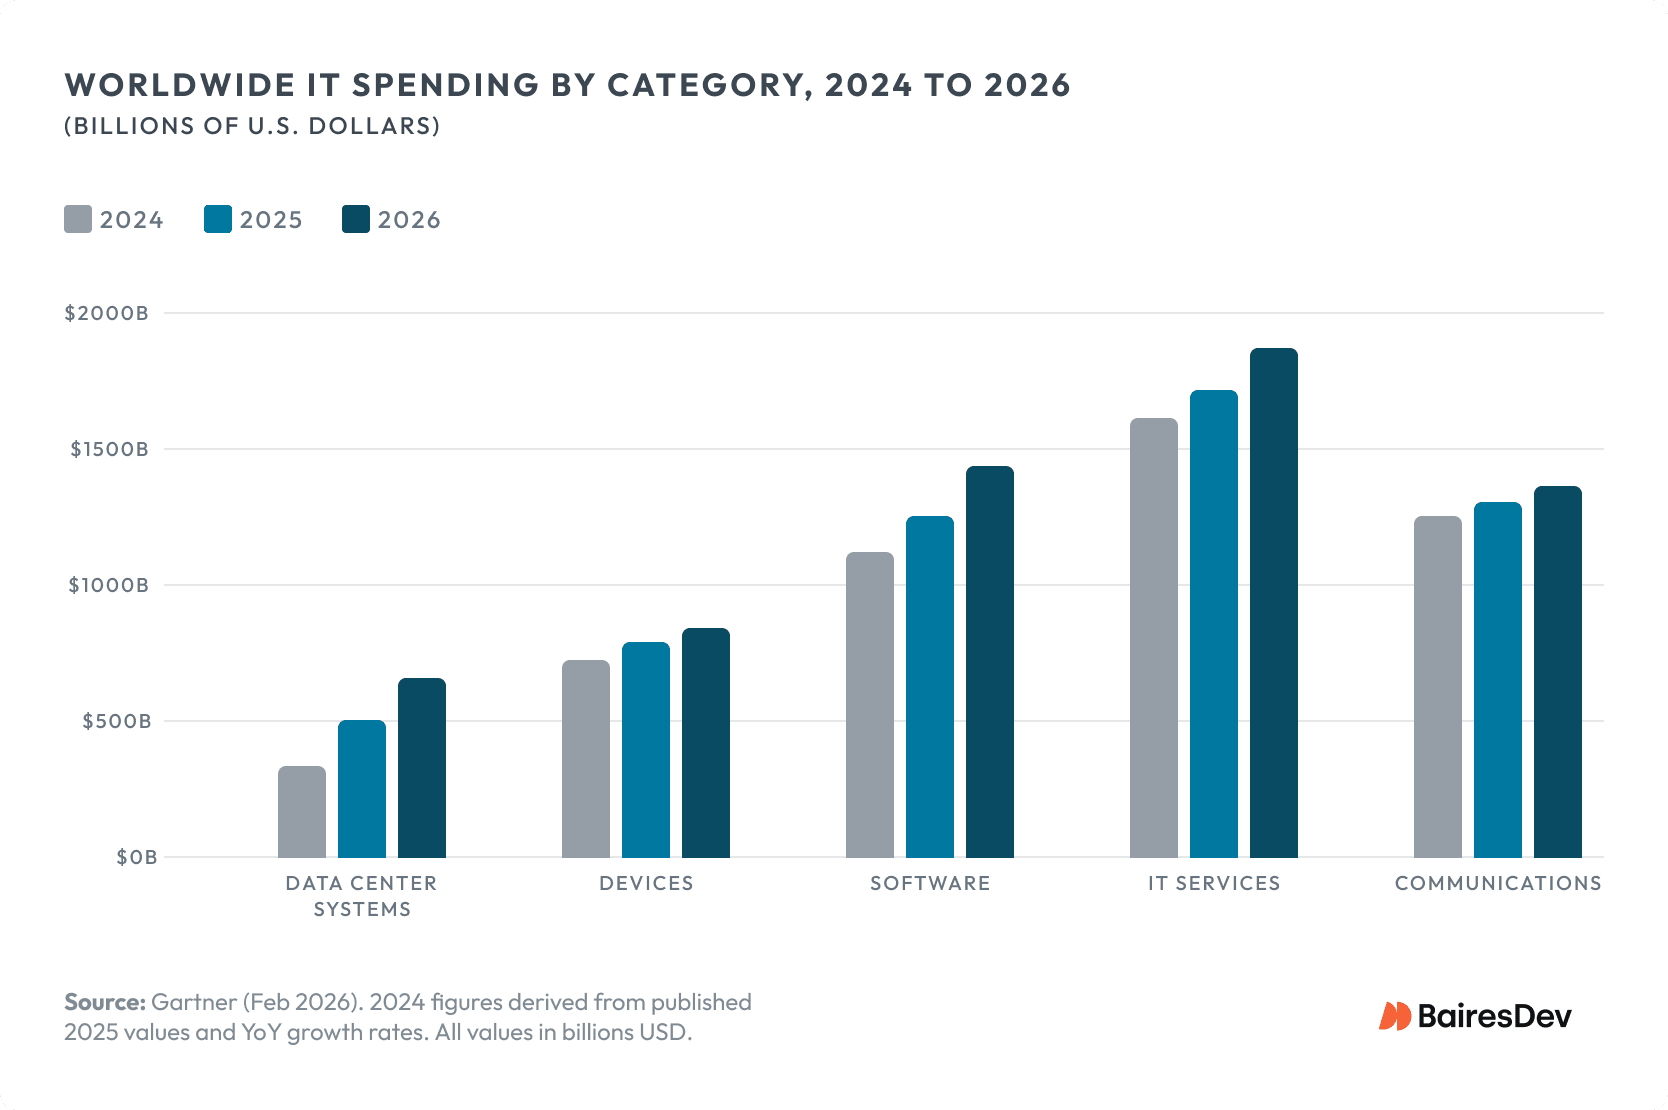
What matters for sourcing decisions is where this spending is going. Investment is tilting heavily toward cloud infrastructure, artificial intelligence, and platform engineering. Meanwhile, traditional categories such as devices and legacy application maintenance are growing more slowly or are flattening.
This trend shapes what buyers need from outsourcing partners: less generalist staff augmentation, more cloud-native development and platform-specific expertise.
The CFO perspective reinforces this pattern. A Gartner survey of 303 finance leaders found that nearly half expect technology budgets to rise by 10 percent or more in 2026. But headcount growth expectations are collapsing, from 6 percent in 2025 to just 2 percent in 2026, with only 21 percent of CFOs planning staff increases of more than 4 percent.
Technology budgets are expanding while permanent headcount is tightening, and that gap directly fuels demand for external engineering teams.
Contract Activity: Record Levels, Selective Buying
The ISG Index, which tracks outsourcing contracts with annual contract value (ACV) of $5 million or more, confirms that enterprise buying is active, but increasingly selective.
In the Americas, the combined market for managed services and cloud-based as-a-service (XaaS) generated a record $65.9 billion in ACV during 2025, up 25 percent year-over-year and three times the growth rate of 2024. Managed services ACV crossed $23 billion for the first time on a record 1,640 contracts. Within that category, IT outsourcing grew 9 percent for the full year, driven largely by application development and maintenance services, which is the segment most closely aligned with software outsourcing. Engineering R&D services, though, showed a 12 percent decline in Q4.
The dominant pattern is consolidation. Buyers favor fewer, deeper relationships with larger providers for AI-powered transformation, supplementing with niche specialists. Deals are shifting toward shorter commitments, modular scopes, and outcome-based pricing rather than long, labor-centric contracts.
ISG forecasts 2.1 percent revenue growth in managed services globally for 2026, compared to 20 percent growth in XaaS. Traditional labor-centric outsourcing is stabilizing, while consumption-based and platform-led models are pulling ahead. Regional divergence is also pronounced: the Americas posted close to 10 percent managed services growth in 2025, while Europe was roughly flat and Asia Pacific declined more than 25 percent.
U.S. Tech Hiring: Mixed Signals, Persistent Gaps
The U.S. tech hiring picture in late 2025 and early 2026 is uneven in ways that directly shape sourcing decisions.
CompTIA’s analysis of Bureau of Labor Statistics data shows tech unemployment reached 4 percent in Nov 2025, the year’s high, while national unemployment was 4.6 percent. Tech jobs fell by 134,000 that month. In Jan 2026, the sector lost another 20,155 jobs. Most were in telecom, while IT services and custom software had modest gains.
Forward indicators tell a somewhat different story. Employer job postings for tech talent increased 13 percent from December 2025 to January 2026, and year-over-year new postings are running 15 percent above prior levels. Hiring intent is there, but execution remains cautious as employers navigate concurrent uncertainty across macroeconomic, geopolitical, and AI-related fronts.
For engineering leaders, this creates a familiar tension. Budgets support delivery expansion, but permanent hiring is constrained by slower approval cycles, open questions about the longevity of roles as AI reshapes workflows, and persistent competition for specialized talent.
The net effect is continued reliance on flexible external teams and outsourcing firms, where domestic supply has not kept pace with demand.
Immigration Policy Is Redesigning Delivery Models
If the labor market is creating demand for outsourcing services, immigration policy is now shaping where that work gets done. The most consequential change in the past 12 months has been the dramatic increase in friction around U.S. work visa programs.
In September 2025, the White House imposed a $100,000 supplemental fee on new H-1B visa petitions for workers outside the United States. This fee, effective for 12 months from September 21, 2025, represents a 1,500 to 5,800 percent increase over previous filing costs. In December 2025, DHS finalized a rule implementing a wage-weighted H-1B lottery, effective February 27, 2026, which gives priority to higher-paid positions.
Separately, the proposed H-1B and L-1 Visa Reform Act of 2025, introduced with bipartisan sponsorship, would cap H-1B holders at 50 percent of an employer’s workforce and restrict placement at third-party client sites.
The practical impact is already visible.
The $100,000 fee makes H-1B sponsorship uneconomical for services delivery models that commonly rely on rotating onsite staff from offshore locations. Research from the Federal Reserve Bank of Richmond notes that the IT services sector is most exposed, given that many H-1B workers in that sector earn annual wages below the fee itself, and that firms may respond by moving operations offshore more aggressively.
For engineering delivery, this accelerates a shift that was already underway: distributed-first from day one. Rather than designing for onsite presence with offshore support, teams are being built as fully remote or nearshore from the outset.
The onsite-heavy staffing model that defined outsourcing for two decades is becoming economically unworkable under the current policy environment. The cost efficiency isn’t there anymore.
Nearshore Outsourcing: Scale vs. Velocity
With distributed delivery becoming the default, the choice of delivery region carries more weight. Two broad options dominate the landscape, each having distinct advantages and constraints.
South and Southeast Asia: The Scale Engine
India is the largest global IT services player. NASSCOM reports that India’s tech industry generated $283 billion in FY2025, up 5.1 percent, and is likely to reach $300 billion in FY2026. The tech workforce is 5.8 million, with 1.5 million engineering graduates annually. Over 1,750 global capability centers and top IT firms in India can staff teams of 500 or more in major metros.
The Philippines complements India, especially in BPO and digital customer experience. IBPAP reported that the IT-BPM sector reached $40 billion in revenue and 1.9 million employees in 2025, targeting $42 billion in 2026, driven by growth from global capability centers and rising demand in finance and health care.
Both markets offer mature ecosystems and cost advantages of 50 to 70 percent below U.S. rates. However, both India and the Philippines face a significant time-zone gap with the U.S. (9.5 to 12 hours ahead of Eastern Time), which limits synchronous collaboration to 2 or 3 hours per day at best.
This time difference can hinder rapid, tightly coupled engineering efforts, making these regions best suited for well-scoped work that does not require constant real-time interaction.
Latin America: Time-Zone Alignment and Collaboration Speed
Latin America is carving out a specific niche in the outsourcing landscape, not as a replacement for South and Southeast Asia, but as a delivery model optimized for different constraints.
The region’s outsourcing market is projected to reach approximately $20 billion in 2026, growing at roughly 9 percent annually according to multiple industry estimates.
Mexico leads, with an estimated 800,000 tech professionals across hubs such as Guadalajara, Monterrey, and Mexico City. Colombia’s tech ecosystem, centered on Bogotá and Medellín, is expanding rapidly, driven by government-backed incentives and a growing STEM pipeline. Brazil offers the largest absolute talent pool in the region with over 500,000 developers.
LATAM’s core advantage is operational rather than purely economic.
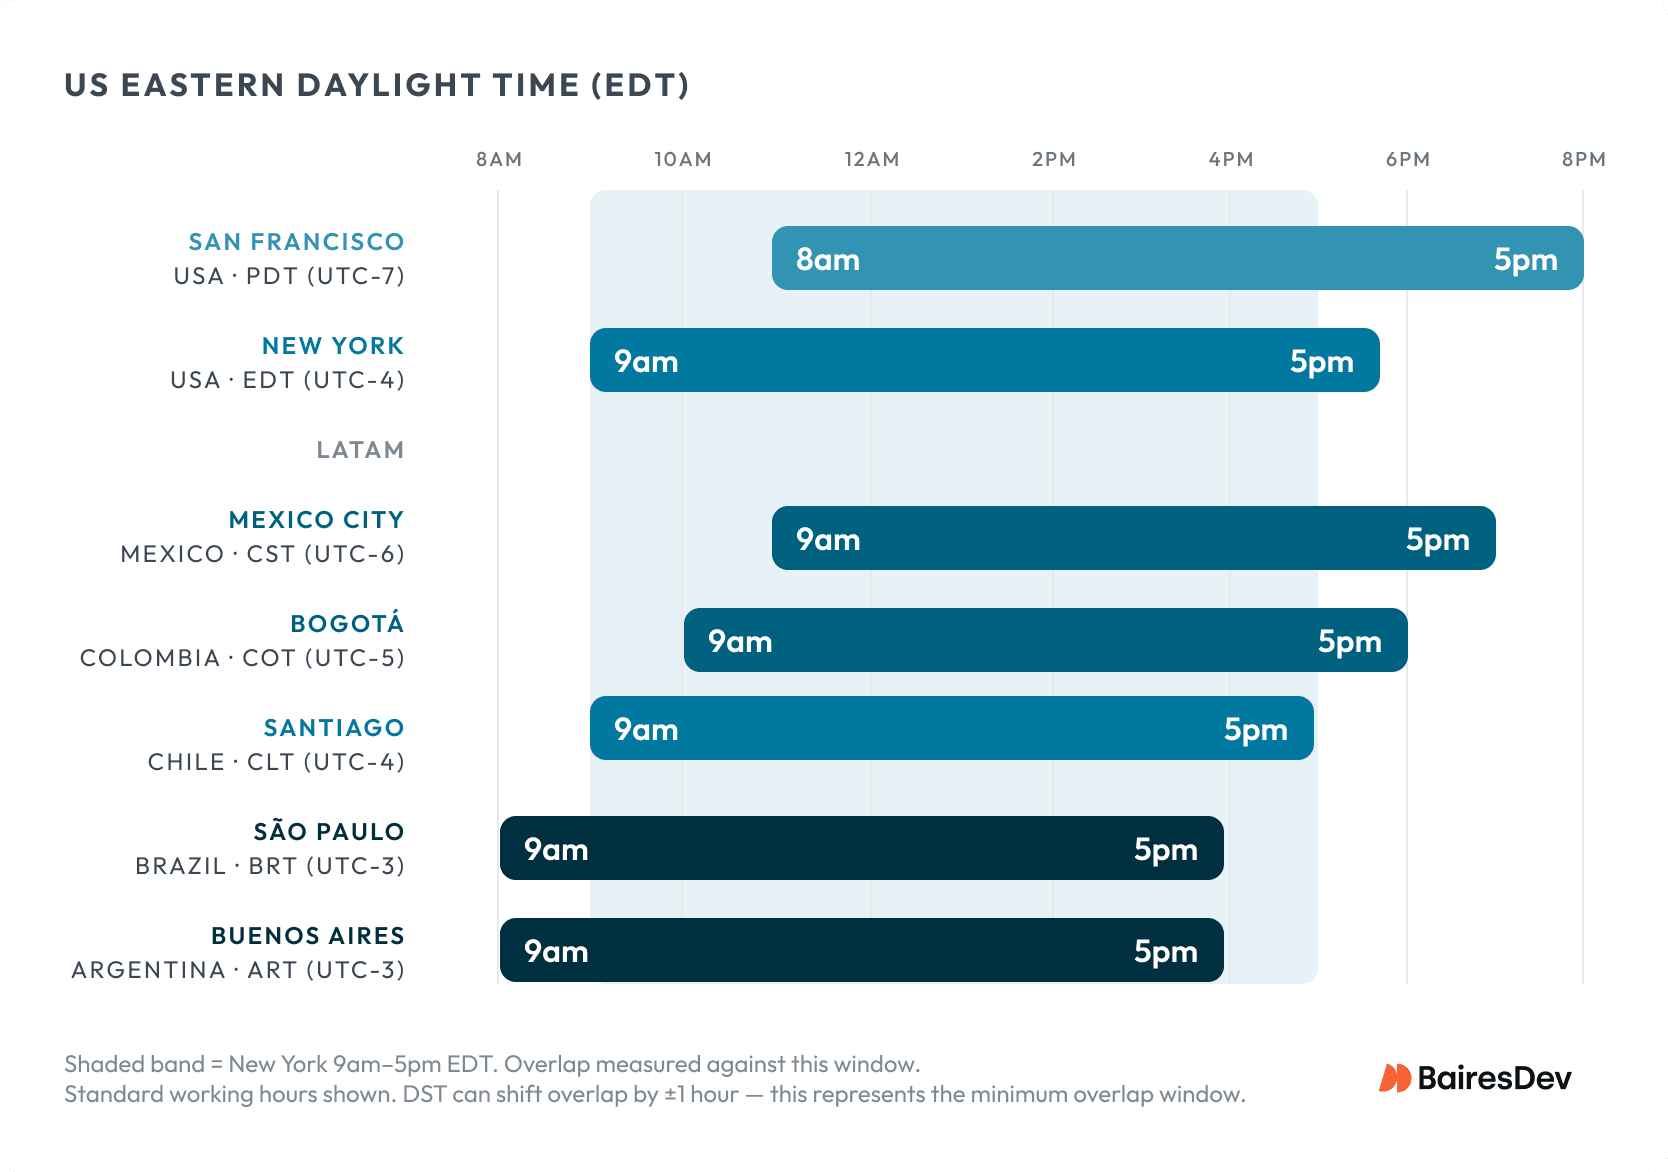
With zero to three hours of time-zone offset from U.S. business hours, nearshore teams enable the kind of synchronous collaboration (stand-ups, code reviews, incident response) that offshore models cannot replicate without significant schedule distortion. Cost savings are real but narrower than offshore alternatives: typically 30 to 55 percent below U.S. rates, compared to 50 to 70 percent for South Asia.
Nearshore work delivers disproportionate value when collaboration speed matters more than labor costs, such as product engineering sprints, platform integrations, and customer-facing development. Often, a nearshore solution is sought when product or technology leadership is US-based, or when other development resources are located within the US. In these contexts, the cost of communication latency often exceeds the savings from lower hourly rates.
Central and Eastern Europe: Technical Depth, European Alignment
Central and Eastern Europe fields roughly 1.75 million developers, led by Poland, Romania, Ukraine, and Bulgaria. The region’s IT services market is projected to approach $18 billion by 2029.
Technical specialization runs deep, particularly in cybersecurity, fintech, and embedded systems, and EU membership gives countries like Poland and Romania built-in GDPR compliance. For European buyers, CEE is a natural nearshore fit: one to two hours ahead of Western Europe, culturally aligned, and 30 to 60 percent below Western European rates.
For U.S. engineering teams, the calculus is different. CEE sits six to eight hours ahead of Eastern Time, leaving three to four hours of workday overlap, roughly the same synchronous window as India. English proficiency and Western business norms are stronger than in South Asia, but the region can’t match Latin America in English proficiency or real-time collaboration. The Russia-Ukraine conflict has excluded Russia and also shifted some sourcing away from Ukraine toward Poland and Romania.
CEE makes sense for U.S. companies that need European regulatory expertise or don’t depend on deep daily overlap, but for teams that prioritize synchronous collaboration speed, LATAM holds the advantage.
The following tables summarize the key comparisons and data points discussed throughout this analysis.
LATAM vs. CEE vs. Asia: Comparative Overview
| Dimension | Nearshore (Latin America) | Central & Eastern Europe | South/SE Asia (India, Philippines) |
| Developer pool | ~2M+ across region | ~1.75M across region | 5.8M+ (India); 1.9M (Philippines) |
| Cost savings vs. U.S. | 30–55% | 30–60% | 50–70% |
| Time-zone overlap (U.S. ET) | 6–8 hours synchronous | 3–4 hours synchronous | 2–3 hours synchronous |
| Typical use cases | Product sprints, platform work, customer-facing dev | Cybersecurity, fintech, embedded systems, EU-regulated work | Large-scale maintenance, enterprise migrations, 24/7 ops |
| Ecosystem maturity | Growing rapidly: strongest in Mexico, Brazil, Argentina | Mature: Poland and Romania lead, strong university pipeline | Mature: decades of delivery infrastructure |
| U.S. policy exposure | Low: remote delivery, no visa dependency | Low: remote delivery, no visa dependency | Moderate to high: H-1B changes affect onsite models |
| Scale capacity | Moderate: multi-location strategy needed for 100+ teams | Moderate: multi-country sourcing needed for large teams | High: 500+ teams from single metros in India |
Market Snapshot
| Metric | Value | Source |
| Global IT spending (2026) | $6.15T (+10.8% YoY) | Gartner, Feb 2026 |
| Software spending (2026) | >$1.4T (+14.7%) | Gartner, Feb 2026 |
| Americas combined ACV (2025) | $65.9B (+25% YoY) | ISG Index, Q4 2025 |
| Managed services growth (2026f) | 2.1% | ISG, Jan 2026 |
| XaaS growth (2026f) | 20% | ISG, Jan 2026 |
| U.S. tech unemployment (Nov 2025) | 4.0% (vs. 4.6% national) | CompTIA / BLS |
| CFO headcount growth (2026) | 2% (down from 6%) | Gartner, Feb 2026 |
| India tech industry revenue (FY2025) | $283B (+5.1%) | NASSCOM |
| Philippines IT-BPM revenue (2025) | $40B (+5%) | IBPAP |
| LATAM outsourcing market (2026) | ~$20B | Industry estimates |
| H-1B supplemental fee (eff. Sept 2025) | $100,000/petition | White House |
Policy and Labor Timeline (2025–2026)
| Period | Key Developments |
| Q1 2025 | U.S. tech unemployment at 3.3% (February); tech job postings trend 15% above prior year. |
| Q2 2025 | Americas ISG Index hits record $15.5B quarterly ACV (+26% YoY). Tech unemployment peaks at 3.5% in April before declining. |
| Q3 2025 | White House imposes $100,000 H-1B supplemental fee (eff. September 21). The H-1B and L-1 Visa Reform Act was introduced with bipartisan sponsorship. CompTIA reports 247,000 new tech jobs in September. |
| Q4 2025 | Americas’ full-year ACV reaches $65.9B (+25%). Tech unemployment hits 4% in November. DHS finalizes wage-weighted H-1B lottery rule. NASSCOM: India tech at $283B. IBPAP: Philippines IT-BPM at $40B. |
| Q1 2026 | Gartner forecasts $6.15T global IT spending (+10.8%). CFO headcount expectations fall to 2%. Wage-weighted H-1B lottery takes effect (Feb 27). Tech job postings increase 13%, MoM. |
Reading the Signal
The data across spending, contracts, labor markets, and policy points in a consistent direction. Enterprise technology budgets are growing, but the growth is flowing disproportionately into cloud, AI, and platform work.
Permanent headcount expansion is stalling even as those budgets increase. Immigration policy has materially raised the cost of on-site delivery. And regional outsourcing markets are diverging: South and Southeast Asia offer unmatched scale, and Latin America offers collaboration speed that offshore models cannot match.
These are not cyclical swings. The shifts in spending, the budget-headcount divergence, and the policy changes all reflect conditions unlikely to reverse in the near term. For engineering leaders evaluating their delivery mix, the question the data raises is whether the assumptions built into current outsourcing partnerships (on-site presence, single-region dependency, and labor arbitrage economics) still hold up against the market that is actually taking shape.


